This article was written by Bloomberg Index Research analysts Michael Donat, CFA and Steve Hou, PhD, and Bloomberg Gender-Equality Index manager Sabina Mehmood.
Corporate gender equality is among the ESG (environmental, social, and governance) issues that often receives the most investor attention. But how can investors, constrained by a broad-based benchmark, create a portfolio that is expressive of gender-equality goals, and what do the resulting portfolios look like? In this and subsequent articles, we seek to shed some light on these questions.
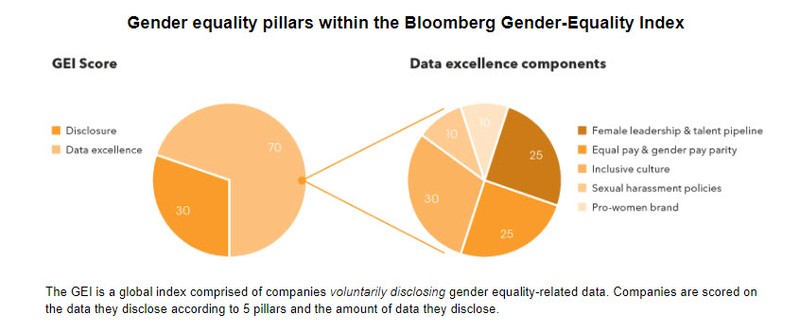
First, we acknowledge that gender equality is a multi-dimensional issue. People often equate it with equal pay or equal opportunity for career advancements. In reality, gender equality is about addressing both the tangible and intangible structural disadvantages women face in the workplace. Bloomberg’s Gender-Equality Index (GEI) illustrates this, comprised of 78 variables covering five pillars.
Here, we take a slightly different tack than the survey-based GEI and focus on benchmark-based gender-sensitive portfolios. While corporate participation is rapidly increasing (approximately 460 companies are participating in 2021), more data is needed in order to comprehensively track a broad-based global benchmark.
Overall, our objective in this series of articles is to understand the following:
- The currently available ways in which an investor can tilt towards gender equality issues.
- Implications of tilting towards these issues using liquid benchmark indices.
- Measurable impact on gender issues in the final portfolios.
Data and security coverage
Our ability to observe companies’ performance on gender equality is constrained by data availability. Data on gender equality are either self-reported by companies in required filings or solicited by data vendors through surveys. As a result, there is often a trade-off between breadth and depth of data coverage. As an example, we focus on the first pillar of the Bloomberg Gender Reporting Framework, the Female Leadership & Talent Pipeline (“FLTP”), which represents a company’s commitment to attracting, retaining, and developing women into senior leadership positions. Components of this pillar have the broadest coverage and longest history of reporting from public companies.
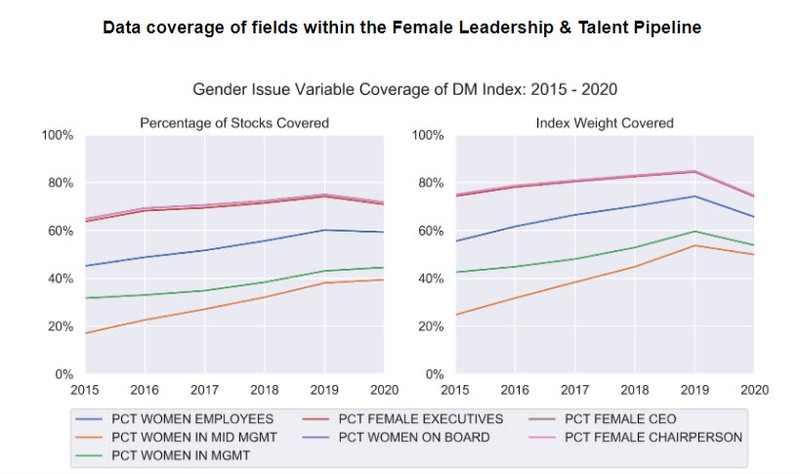
Specifically, we focus on seven variables that track female career advancement and leadership representation, all of which were collected from regulatory filings. Collectively, these variables cover 1000-3500 companies globally and in 2020 at least 50% of our broad-based benchmark weight as represented by the Bloomberg Developed Markets Large & Mid Cap Total Return Index (DMTR). Even with the most broadly reported variables, security coverage in terms of market capitalization is only modest. Fortunately, data coverage is generally close to benchmark weights in terms of Bloomberg Industry Classification System Level 1 (BICS1) sectors and country splits.
Interpreting the FLTP data
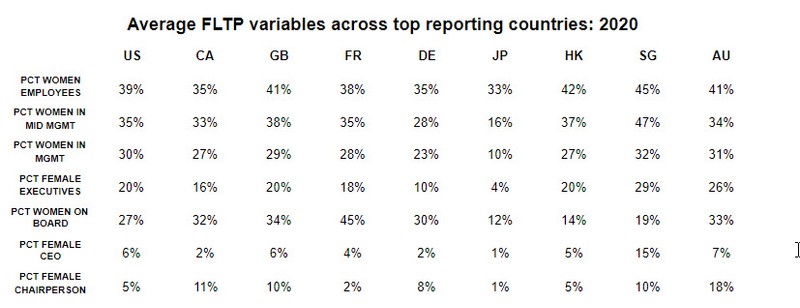
We show the average variable values for companies across countries with the most coverage and notice variation. While female representation generally declines farther up the corporate ladder, there are some persistent differences across the countries, with Japan consistently being the lowest and Singapore appearing towards the upper part of the data range.
For another perspective on the data, we show the field averages along sector lines. Similar to the country breakdown, we observe that, across all sectors, female representation declines as management level increases and that there is variation across sectors for a given management level. Additionally, some sectors, such as financials, may have higher overall levels of female representation, while others, like materials, display lower levels of female representation.
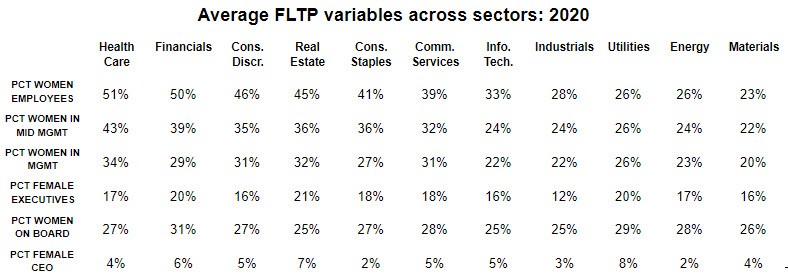
In analyzing both sets of data, a clear picture emerges: females are significantly underrepresented in all levels of management, regardless of region or sector.
Questions for a deeper dive
Despite the empirical backdrop, investors still have a rich set of portfolio construction decisions that must be carefully weighed to create a portfolio that expresses their FLTP goals. In fact, the analysis prompts a number of questions:
Score construction
- How can the existing data be combined into a single score and what should that score represent: high levels of female representation, high rates of female advancement, or year on year changes?
- What are sensible ways to weight the different underlying issues within a composite score?
- How can missing data be handled?
Portfolio exposures
- What FLTP per unit of tracking error benefit will be had from overweighting countries versus overweighting sectors?
- How appropriate is it to take country or sector bets and are regulatory or societal norms causing these differences?
- How can exposures to known equity risk model factors like value and momentum be incorporated to the portfolio construction process, if at all?
Questions for performance
- What is the incremental financial-performance from tilting towards FLTP?
- What is an obtainable level of portfolio FLTP given real-world investor constraints?
- What impact does a portfolio with high FLTP exposure have in the real world?