This article was written by Bloomberg Index Research analysts Michael Donat, CFA and Steve Hou, PhD, and Bloomberg Gender-Equality Index manager Sabina Mehmood.
Corporate gender equality is a multidimensional issue that has garnered increased attention from the investment community. Investors, often constrained by a broad-based benchmark tracking mandate, must also contend with the depth and breadth of data availability when constructing portfolios. For ESG investors focusing on gender, a compromise between these two constraints can be made by focusing on the Female Leadership & Talent Pipeline (FLTP) pillar. This pillar, as defined by the Bloomberg Gender-Equality Index (GEI), measures a company’s commitment to attracting, retaining, and developing women to take on senior leadership positions.
In this piece, we outline how our FLTP data can be combined into company-level scores. While no singular score will reflect every investor’s gender equality end goals or fully capture the issues restricting gender equality, we highlight how blending qualitative and quantitative analysis offers meaningful paths for investors to consider.
Forming a view
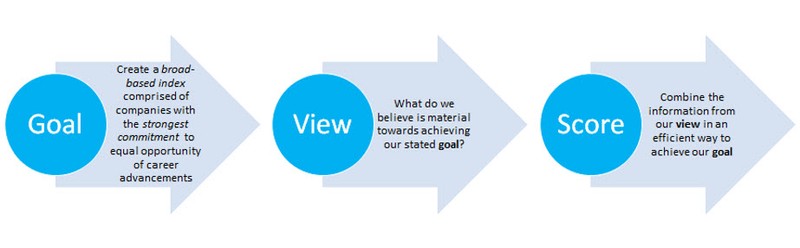
Score construction starts with defining a goal and forming a specific view in which variables are important for capturing and achieving that objective. Our motivation is to create a broad-based index that identifies a set of companies showing the strongest commitment to equal opportunity of career advancements for men and women. But what is material towards achieving this goal? Is it good enough that a company’s leadership is female? Uncovering what is material towards this goal will become our view.
Processing data
In a previous post, we discussed the data fields that have the broadest availability within the FLTP pillar. Here, we revisit a subset of these fields and introduce an additional field: a ratio of the percentage of women in management to the percentage of women employees. This variable is meant to capture the likelihood of women progressing into senior positions within the firm.
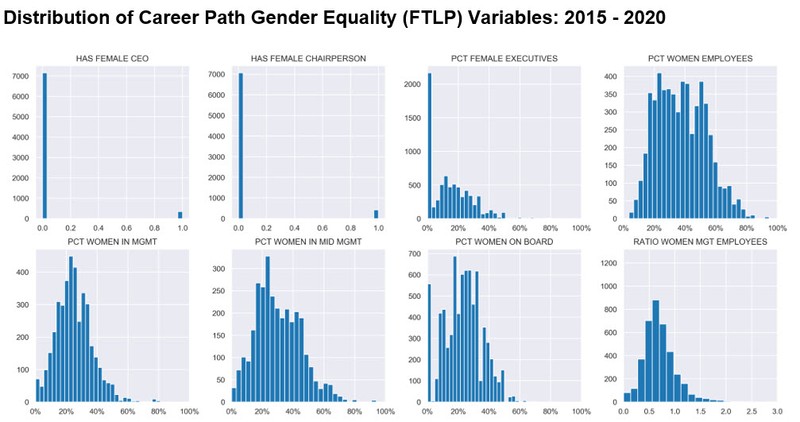
Several observations can be made from visualizing the distributions of our data:
- The two binary variables HAS FEMALE CEO and HAS FEMALE CHAIRPERSON are the most widely available.
- PCT WOMEN ON BOARD appears to accumulate at 30%, which likely reflects investor standards.
- The RATIO WOMEN MGT EMPLOYEES is well below 1, which indicates a lack of female managers.
In order to account for the fact that these data fields have different units, variabilities, and degrees of availability, we take the following steps to process the data:
- Exclude companies with missing values in the two binary variables from the investment universe.
- Standardize all the data fields so that continuous variables have an average of 0 and a standard deviation of 1. Field-level missing values are given a 0, which reflects the average value.
- Binary variables will continue to have values of 0 and 1.
Each of these choices are active and illustrate real-world decisions that investors must make in the face of incomplete data. For purposes of exposition, we have opted for a simple and transparent approach.
How can variables be combined into a single score?
A company’s overall score is a weighted sum of the standardized individual variable values. In principle, we should overweight the fields that are most impactful towards achieving our goals. This is the part of score construction that will benefit strongly from intuition as well as quantitative analysis.
Leveraging additional analysis and corporate engagement through the Bloomberg Gender-Equality Index reporting workflow, we also consider qualitative components that may influence the employee pipeline. This analysis revealed that higher levels of female senior managers or executives tend to better reflect a company’s attitude towards gender equality. For example, the CEO, chairwoman, or other senior executive positions could be external hires as a company tries to diversify their leadership. While this is clearly a positive development, it doesn’t necessarily have the immediate downstream effect on the employee talent pipeline that one may expect. Instead, it is an increased representation of women as senior managers, where more mid-level managers and individual contributors will see the positive effects of diverse leadership in their day-to-day, which is also integral to strengthening the pipeline.
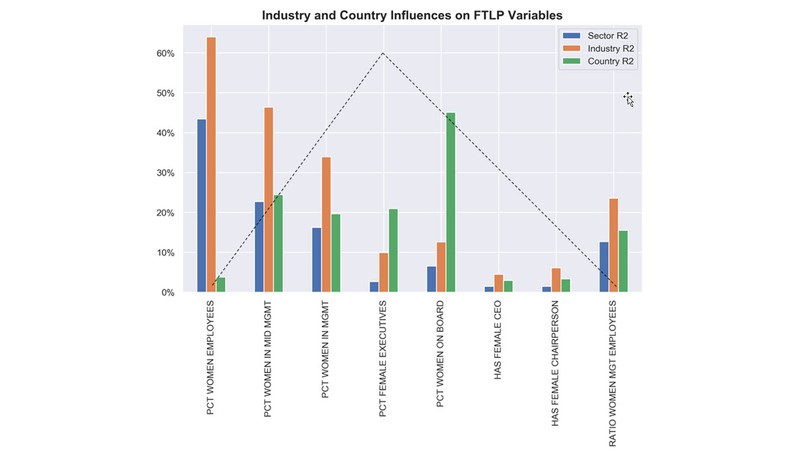
On the quantitative side, we used regression analysis to complement our GEI insights. We ran univariate regressions of the company-level data fields against the respective sector and country averages. Our goal was to see how much the company-level fields were explained by their sector or country and we can then plot the R2 (R-squared or goodness of fit) for these regressions. For example, we observe that a large portion of a company’s PCT WOMEN EMPLOYEES is explained by the sector average. Furthermore, the amount of field-level variation that is explained by sector declines towards the top of the corporate ladder, while the amount explained by the country average rises modestly. Specifically, the percentage of women on board is nearly 50% explained by “Country,” which suggests to us the possibility of country-level quotas or norms.
Does the intuition align with the data?
Taken together, our intuition and quantitative analysis suggest the following about the variables:
- CEO and Chairperson: company-specific, but less relevant towards our goals
- Women in Workforce: sector or country dependent
- Women in Management roles: company-specific and relevant towards our goals
Since we want to select companies based on their individual merit rather than sector or country characteristics, we use a “tent-shaped” weighting scheme (stylized by the dotted line in the above graphic), which gives heavier weight to the company-specific variables.
How sensible is our score?
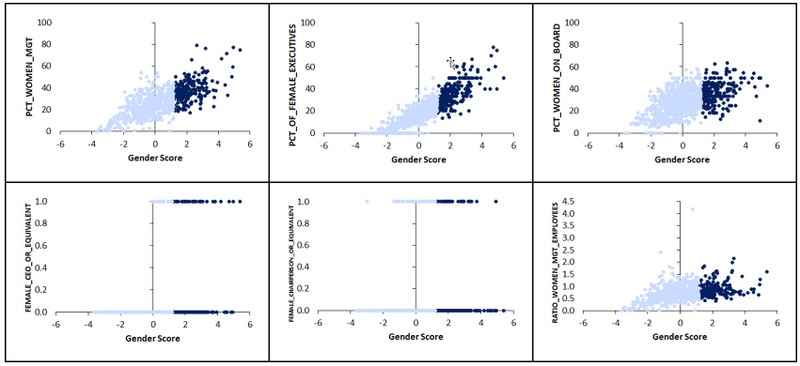
In order to evaluate our score construction, we can look at how the top ranked companies (by our score) behave in terms of their underlying variables. Through a series of scatterplots, we see that the top quintile firms (dark blue) according to our Gender Scores also tend to be top performers in the underlying issues. Unsurprisingly, female executives and management dots lie more to the top right (higher input weight), while board and management ratios tend to lie only towards the right (lower input weight).
Underlying Variable vs Gender Score (2020): Top Quintile Analysis
Additionally, we can plot the average Gender Score by sector and country. Compared to the sector and country plots in the first article cited earlier, we see similar results. Within sectors, Financials are towards the higher end and Materials towards the lower end. Along Country lines, Singapore is towards the top and Japan is towards the bottom.
Aggregated score by sector and county

Going further
As useful as these charts are, our score needs to be placed within a risk-based portfolio context. Ultimately, several more considerations are needed:
- What gender score per unit of tracking error benefit will be obtained by overweighting single companies, sectors, or countries?
- How appropriate is it to take country or sector exposures?
- Are regulatory or societal norms causing the observed score differences?
- Are there known investment factors, such as value and momentum that the Gender Score corresponds with, and is this desirable?