This analysis is by Bloomberg Intelligence Chief Equity Strategist Gina Martin Adams and Senior Associate Analyst Gillian Wolff. It appeared first on the Bloomberg Terminal.
Above-average returns are still likely for global stocks in 2022, our model shows, even in the face of a lower U.S. contribution as tighter policy constrains the region. Non-domestic stocks still have significant upside to price in fundamentals, more than half of global equities trade below long-term average multiples and stocks remain discounted to bonds. Asia may be best positioned among regions in the short run, as inflation pressures, slowing growth and tighter policy tempers the outlook in the U.S. and growth concerns plague Latin America. Currency moves could present the greatest risk.
A rare correlation and dispersion signal favors active over passive strategies in global stocks. The forward 12-month spread implies plenty of room for smaller companies’ multiples to benefit if risk tolerance re-emerges in 2022.
Global model implies stocks’ strength ahead, currency the risk
The outlook looks bright for global equities, our macro model suggests, as non-domestic stocks still have significant upside to price in fundamentals in the year ahead, and a rare correlation and dispersion signal favors active over passive strategies globally. Currency may pose the biggest test.
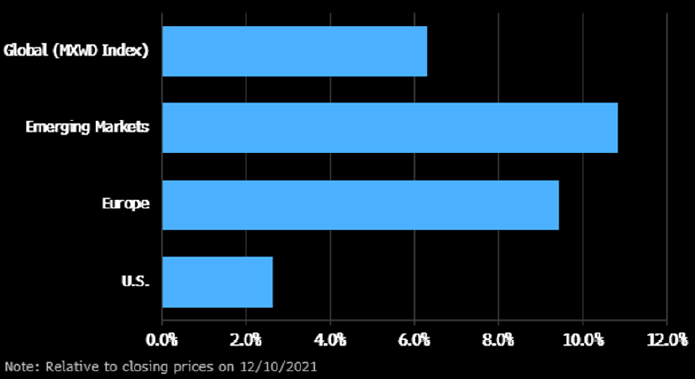
Global fair-value model supports stocks into 2022
Global equities are fairly valued about 6.3% above current levels, our model suggests, implying slightly above-average returns are still likely in the year ahead, though fundamentals indicate upside opportunity may be strongest outside the U.S. The MSCI ACWI Index (MXWD) has delivered a 6.1% annualized return since 1987 (7.9% since 2010). Emerging markets, which struggled in recent months, have the greatest support from our macro model, with fair value 10.8% above current levels (exceeding the 1.7% annualized return since 2010 and 7.4% since 1987).
The S&P 500 has returned 12.7% annualized since 2010, but our model implies merely 2.6% upside as higher rates pressure P/E. Europe’s modeled prospects for a 9.4% return fall short of EM but beat its 5.4% annualized price return since 2010.
Global 1-year expected returns
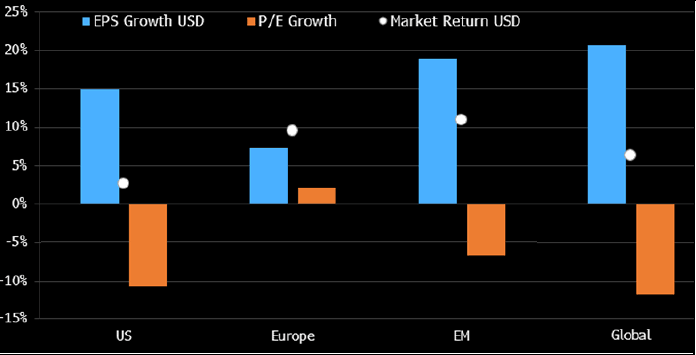
EPS growth powers upside as P/E contained by rates
Global stocks show 6.3% upside in our model, as 20.6% EPS growth is offset by an 11.8% decline in P/E. Prospects in all major regions (the U.S., Europe and emerging markets) are predominantly supported by EPS gains. Europe is the only major market trading below its implied fair P/E multiple, by roughly 2%, but EPS growth of 7.3% (in U.S. dollars) powers the majority of the potential upside. The U.S. and emerging markets may see P/E contract a respective 10.7% and 6.8%, offset by 15% and 19% EPS growth.
U.S. stocks trading 1.7 standard deviations above average P/E (since 2010), while the model suggests a 10.7% contraction is warranted, to 0.65 standard deviation higher than average. Emerging markets trade at about their average P/E, but the fair-value model still implies a contraction to a below-average multiple.
Return sources driven by EPS
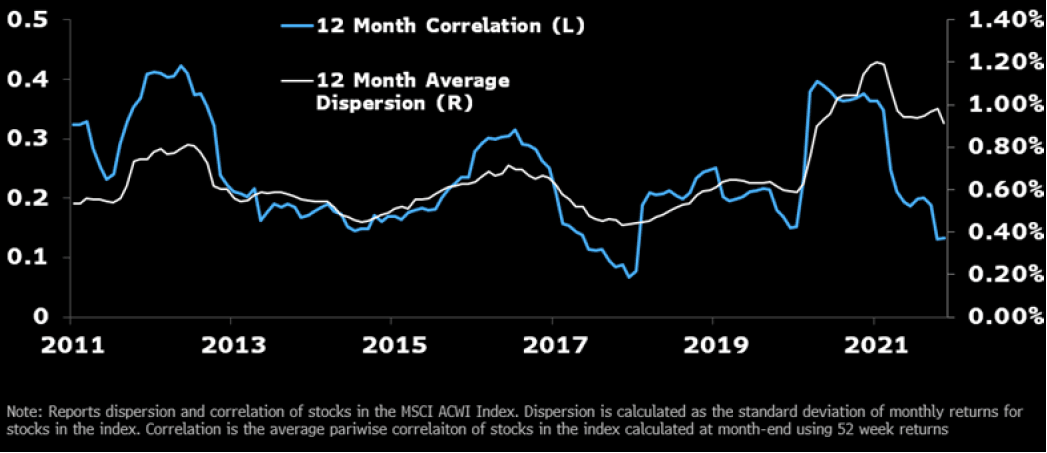
Correlation, dispersion combo supports selection
Opportunities to generate above-market returns through security selection should remain high in 2022, as the MSCI ACWI displays below-average correlation and above-average dispersion, a combination that hasn’t occurred in the past decade but has been in place since March. The 12-month average pairwise correlation between stocks in the MSCI ACWI is about 1.2 standard deviations below their long-term average, and at its lowest level since December 2017. The 12-month average dispersion — defined as the standard deviation of monthly returns for stocks in the MSCI ACWI — is near its record high and 1.4 standard deviations above its 10-year average. It’s declined to 0.91% from its February peak of 1.19%.
MSCI ACWI constituents correlation and dispersion
Fed policy may be markets’ next biggest test
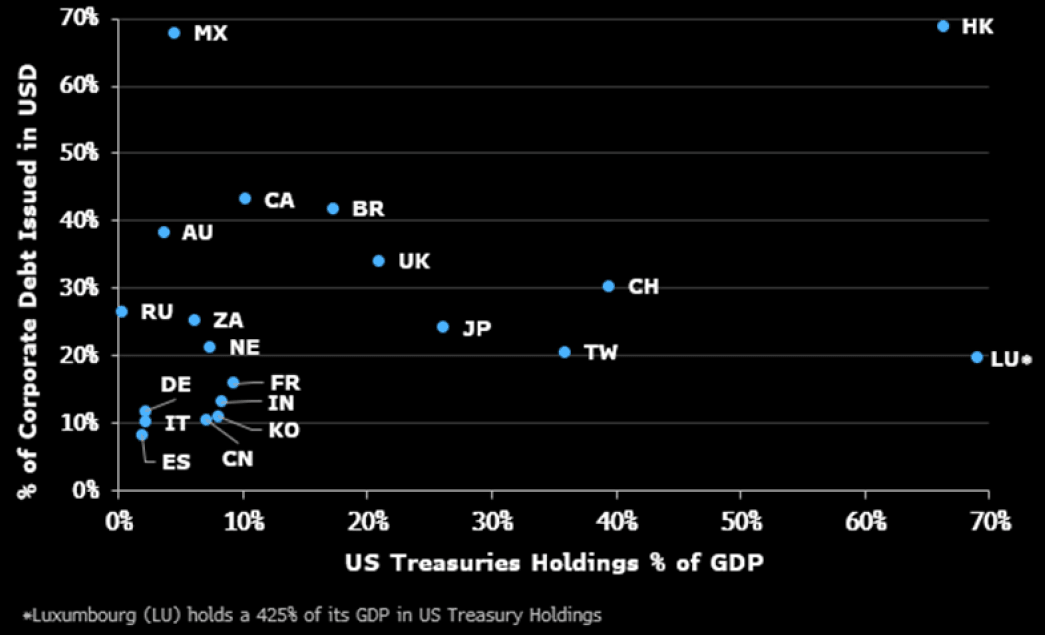
U.S. Federal Reserve Chair Jerome Powell signaled the central bank may need to speed its plan to withdraw financial support from the economy as inflation remains persistent, just weeks after announcing the move, rattling asset prices and signaling potentially higher risk for countries highly exposed to currency via debt markets. The US Dollar Spot Index (DXY) rose 2% in November, and continued gains may spell trouble for countries with a lot of corporate debt issued in dollars or that hold a large percentage of GDP in U.S. Treasuries.
Hong Kong, Brazil, Canada, the U.K., Switzerland and Japan all have an above-median percentage of corporate debt issued in dollars (over 27%), and above-median percentage of GDP held in U.S. Treasuries (more than 14%), leaving them potentially most sensitive to tighter U.S. monetary policy.
Country sensitivity to a strong US dollar