This analysis is by Bloomberg Intelligence Director of Market Structure Research Larry R Tabb and Senior Associate Analyst Jackson Gutenplan. It appeared first on the Bloomberg Terminal.
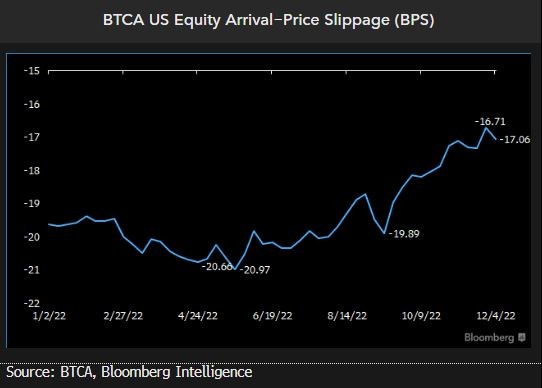
Execution quality of institutional equity trades improved 17.4% over seven months, based on new data aggregated from over 350 BTCA (Bloomberg Trade Cost Analysis) buy-side clients, measuring effective executions against the mid-price at the time of order arrival. Parent orders over 5% of average daily value (ADV) generate much higher costs, as well as trading the most volatile stocks.
BTCA shows improving Buy-Side execution quality
Average slippage across institutional equity trading improved 17.4% over the past seven months from negative 20.66 bps in April to negative 17.06 bps in early December, as buy-side traders recognize executions closer to the mid-price between the bid-ask spread.
Slippage is measured as the difference between the average effective execution of an order and the mid-price at the time of the parent order arrival, divided by the mid-price. Less negative basis points indicated better execution quality, closer to the mid-price of the bid-ask spread. BTCA Peer Arrival Price Benchmarks aggregate all trading-cost observations across over 350 buy-side firms, reported weekly on a rolling three-month average basis, to represent cumulative industry trading costs.
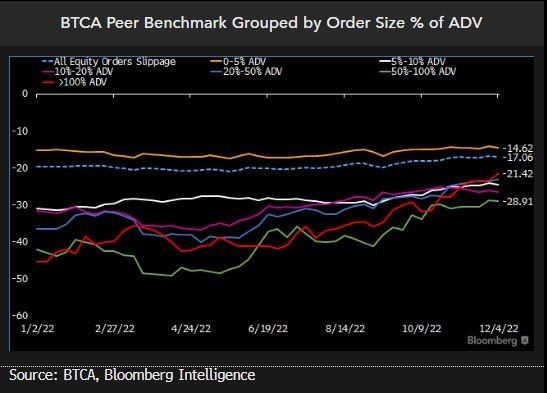
Under 5% of ADV, trade costs drop
Parent orders of less than 5% of the stocks’ ADV generate much smaller-than-average implicit costs of trading, but above the 5% threshold, further increases in order size have a more muted impact on slippage. The three-month average execution slippage at Dec. 4 in orders of 0-5% of ADV was minus 14.62 bps vs. minus 24.6 bps in those 5-10% of ADV. In four larger order buckets (10-20%, 20-50%, 50-100%, over 100%) arrival-price slippage ranged from negative 22.99 bps to minus 28.91 bps. Small orders demand less liquidity, have less market impact and are more likely to be routed through brokers’ off-the-shelf algorithms.
Orders exceeding 5% of a stock’s volume are likely to receive the attentive care of brokers’ high-touch trading desks, which use block trades and split orders into smaller child orders to limit market impact.
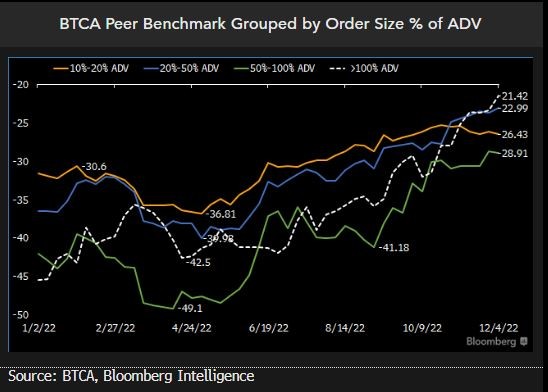
Large orders’ cost of trading improves
Arrival-price slippage in larger parent orders (above 10% of ADV) has improved materially through 2022 as investors recognize lower implicit costs of trading and executions closer to the mid-price on order arrival. Aggregate slippage in large orders worsened in March through June this year, which coincided with the widest NBBO spreads quoted on exchange. As spreads have narrowed from May to December, arrival-price slippage in orders greater than 100% of ADV improved 48.1%. Orders 50-100% of ADV were 39.2% better, the 20-50% bucket 42.5% and 10-20% bucket 28.2%.
Similar slippage costs in orders greater than 100% of ADV and 10-20% of ADV demonstrate the value-add of high-touch brokers.
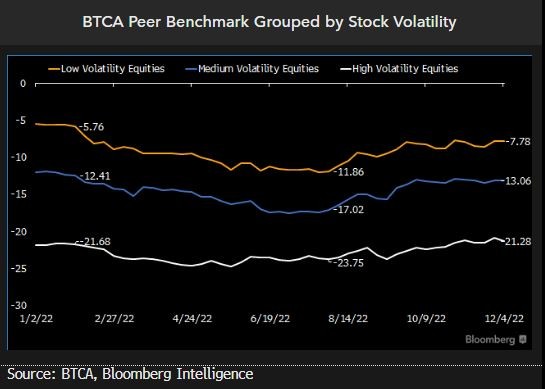
Equity trading costs rise in volatile names
We observe that institutional trades in highly volatile equities experience significantly worse slippage, as traders struggle to source liquidity near the mid-price at the time of parent order arrival through bigger price swings. In our BTCA Peer Benchmark, in which more negative data indicate worse execution quality, we observe an average slippage of minus 22.9 bps across all weekly observations in the most volatile equities. Low and medium cohorts based on average 20-day volatility recognized execution slippage of minus 9.2 and minus 14.6 bps respectively, averaged over 49 weekly observations in 2022.
Though execution quality generally worsens in more volatile stocks, there is no correlation between the VIX Index and the BTCA US Equity Arrival Price Benchmark.