This analysis is by Bloomberg Intelligence Chief European Strategist Mahesh Bhimalingam. It appeared first on the Bloomberg Terminal.
Rates-hit credit returns are outstripping equities but trail on a beta-adjusted basis with ECB credit buying over. This looks set to continue, more so in high grade as credit-to-equity betas rose there while remaining stable in junk. CDS indexes have a smaller gap vs. equities than cash as they’re spared the direct impact of rising yields.
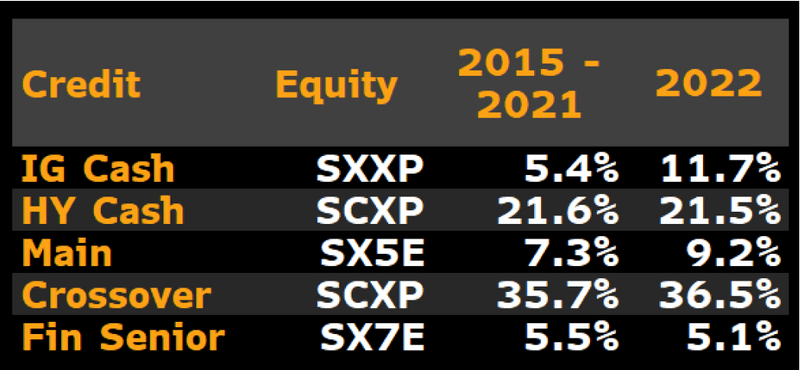
High grade runs Stoxx 600 very close at first glance
On the face of it, the 2022 rout (and small recovery) is a very close race between credit and equity — unlike 2020, when credit returns were greater in the virus-related rout and rally, and 2021 when equities dominated credit in total returns. In a global risk-asset selloff, both assets had a bad year, with high grade credit and equity nearly at par nominally. Across other shades of credit, credit returns were better than in equities, with the gap very wide in high yield and in all CDS indexes. As such, high grade cash is the only place where it’s a close race, nominally.
Even so, to judge credit vs. equity, we need to risk adjust with historical betas, as the two assets shouldn’t be directly compared.
Euro Stoxx 600, high grade: 2022 Total returns
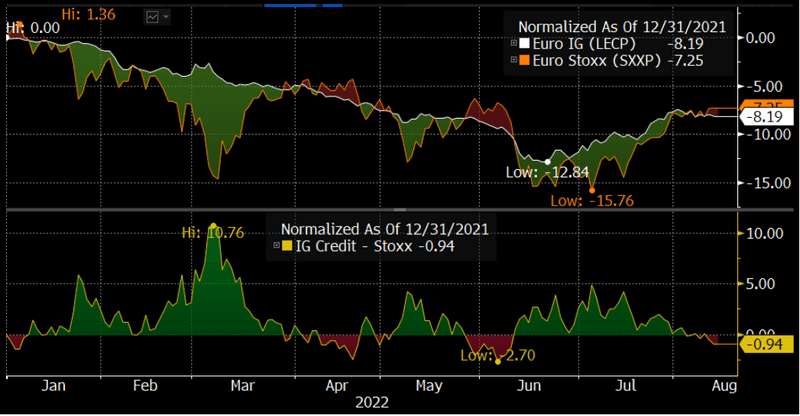
Credit loses to equities after beta adjustment
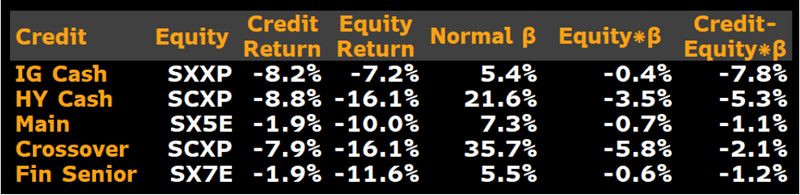
Using beta-adjusted returns for various credit indexes, all have lagged equities despite risk adjustment. The normal betas used are for the ECB QE period (2015-21), and reflect what would have been used by market participants this year. Nominally, it looks like credit returns outstrip equities everywhere, but the reality is found only on beta adjustment — where equity returns are greater. The credit indexes with the biggest adjusted lags are the cash indexes — High Grade (7.8%) and High Yield (5.3%) — while the CDS indexes run equities very close after beta adjustment (just 1.1-2.1% behind).
This backs our belief that rates have been a key driver of the credit rout and cash indexes are fully affected by rates, while the impact on CDS indexes is only indirect through spread correlation.
Credit vs. Equity: 2022 Beta-adjusted returns
High grade beta rose vs. Large-cap equity in 2022
The right way to compare asset classes with different risk-return profiles is to calibrate them relative to each other over a period of time for their hedge ratio, using that to judge relative performance. Historical return betas provide the hedge ratios directly without needing further adjustments. Euro investment grade (LECP) can be compared with the Euro Stoxx index (SXXP), given the profiles of their component companies have many commonalities.
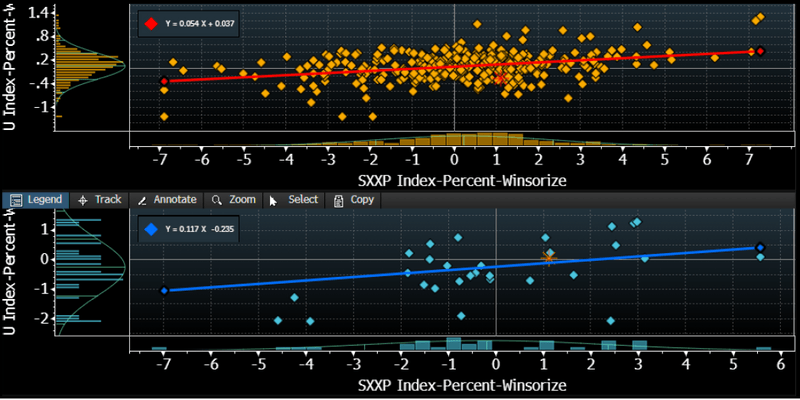
Since the ECB started QE in 2015, high grade weekly returns were 5.4% of equity returns until 2021. In 2022, the high grade beta rose to 11.7%, with pretty low statistical significance as high grade was hard hit by rates for most of the year, weakening the relationship with equities. Hence, high grade lags equities by a huge 7.8% after beta adjusting.
Euro high-grade vs. SXXP beta: QE normal vs. 2022
High yield 2022 beta stable vs. Small caps, still lags post-beta
The right way to compare asset classes with different risk-return profiles is to use their hedge ratio and judge relative performance. Historical return betas provide the hedge ratios directly, without the need for further adjustments. Euro High Yield (I02501EU) should be compared with the Euro Stoxx Small Cap Index (SCXP), given the profiles of their component companies.
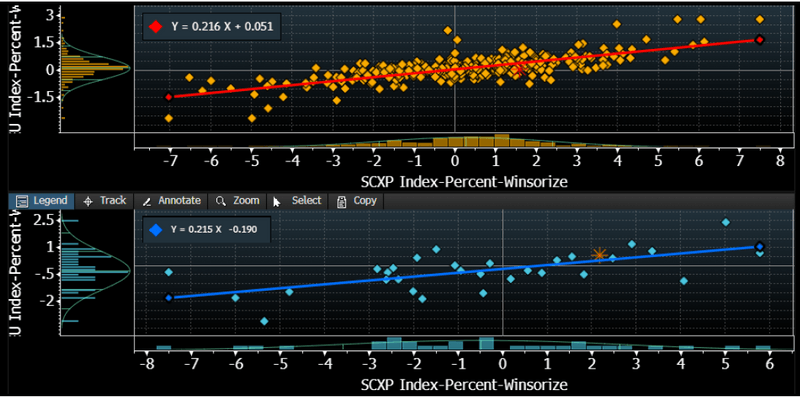
In the seven years between the ECB’s start of QE and 2021-end, weekly junk returns were 21.6% of equity returns, excluding severe outliers. In 2022 the high yield beta has stayed at 21.5% with moderate statistical significance, as the small-cap equity rout has been massive (16.1%), with high yield having a 8.8% downfall. Once beta adjusted, using normal QE-era prior betas, high yield returns were 5.3% below those of small caps, despite the nominal lead.
Euro high-yield vs. SCXP beta: QE Normal vs. 2022
High grade beta vs. Equity rises but junk stable
Investors naturally follow precedents and use hedge ratios that have held up well over time. Looking at the return betas (hedge ratios) over the ECB QE period in 2015-21 vs. 2022, credit-to-equity betas have a curious pattern — they’ve increased for high grade and fallen or remained stable for the rest. This is true in both cash and CDS as both high grade cash as well as Main betas to equity increased this year, while all other forms of credit saw a drop. This is due to the direct (cash) or indirect (CDS) impact of rates on high grade being more than the rest.
High yield cash has been stable in the hedge beta against the small-cap equities index (SCXP), while the Crossover saw a negligible creep. Interestingly, even financial senior CDS index also showed a beta drop vs. SX7E this year.
Credit vs. Equity betas: QE normal vs. 2022