In the ever-evolving landscape of finance, Environmental, Social, and Governance (ESG) investing is more than a buzzword but a force impacting investment strategies. The significance of looking beyond traditional financial metrics to evaluate a company’s performance cannot be overstated. Our previous blog post, ESG Backtesting: A Risk Management Approach to ESG, explored the fundamental role of ESG scores in assessing companies’ performance and managing risks.
Building on that foundation, this follow-up blog delves deeper into the correlation between ESG scores and market performances by sector and geography. In particular, we analyze how US and Europe markets price ESG issues and its components over time and across industries. By scrutinizing these details, we hope to provide investors with unique insights that go beyond generic trends observed in the broader market.
ESG scoring across different sectors and regions
Bloomberg’s ESG Scores look at the financially material Environmental, Social and Governance data points for a company operating in a specific sector. In this blog, we utilize Bloomberg’s ESG Score Percentile (“Score Percentile”), which is normalized between 0 and 100 with 0 being bad, and 100 being good. The percentile is based on ESG scoring in a peer group and the companies’ aggregated ESG performance. The resulting percentile illustrates what percentage of scores lie below a given company’s ESG score. The use of percentiles makes it possible to compare scores for companies in different peer groups.
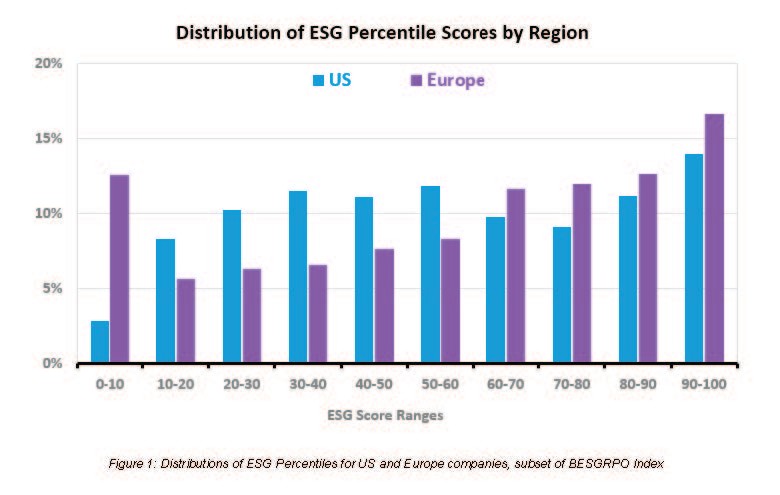
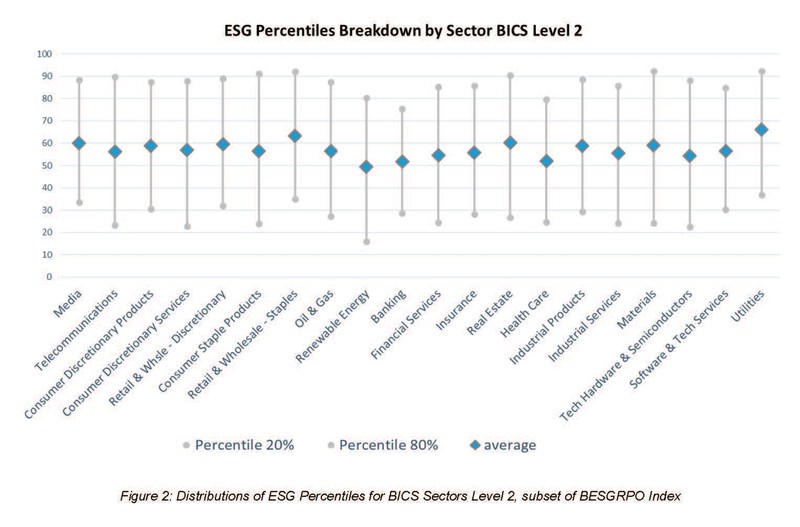
Figures 1 and 2 visualize the distribution of ESG Percentiles for the US and Europe as well as the breakdown by sector, illustrating the diversity of companies’ ESG performance. For example, in figure 1, we can see that there are approximately 12% of European companies with a score lower than 10 and 16% above a score of 90.
ESG backtesting per region: mileage may vary
Now that we have a measure of ESG performance that facilitates comparisons across sectors and industries, we can systematically backtest these scores and their components to understand the conditions of market performance. To run these systematic backtestings, we conducted an analysis for the period 2016-2023 of companies included in the WORLD Index, a Bloomberg index of the world’s most liquid companies that covers more than 2,500 companies. We have compiled five equally weighted baskets from this index according to ESG Percentile. Since ESG data reported by companies is annual, we rebalance our basket of stocks to be on an annual basis as well.
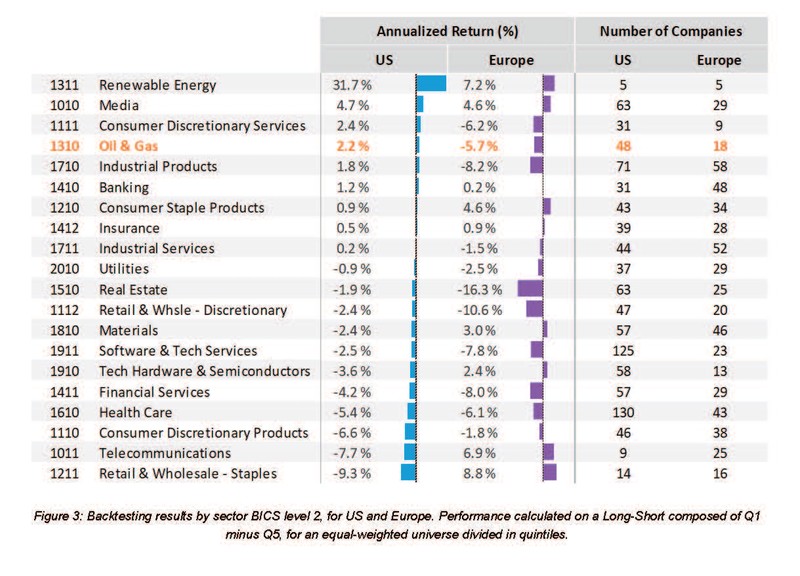
As shown in figure 3, performances vary by region and sector. These kinds of divergences are not surprising as the importance of ESG issues varies across industries and cultural priorities around ESG differ across regions.
Performance across ESG components
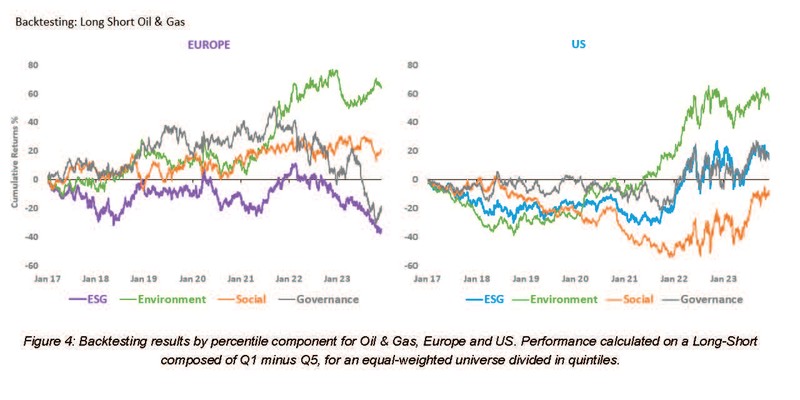
The results in Figure 3 show that ESG Percentile has performed well for the Oil & Gas sector in the US and negatively in Europe. To dig deeper into this, we look at the specific backtesting results of this sector for ESG Percentile as well as its components by Environment, Social and Governance criteria.
Figure 4 shows the results of this backtesting, which are the cumulative market performance of theoretical equity long and short baskets built on each percentile score for both regions. Results highlight that the environmental component of Oil & Gas has been actually performing well in both regions, especially during the period 2021-2023, in the wake of higher inflation post Covid-19. It is interesting to note that in this sector, companies with the best environmental practices have, on average, been rewarded by financial markets. This is just an example of insights one can glean from Bloomberg’s comprehensive and detailed ESG data.
Takeaways for investors
ESG performance is not uniform across countries, sectors and time. Closely monitoring how markets have reacted to ESG in different conditions can help investors better integrate ESG criteria alongside more traditional financial criteria to make more informed decisions when screening for companies.
Bloomberg provides ESG scores for over 15,000 issuers, both public and private, available on the Bloomberg Terminal via ESG SCORE <GO>, W <GO>, and the Excel API. Bloomberg Data License clients can also access Bloomberg’s ESG scores at data.bloomberg.com for scalable enterprise-wide use. To learn more about all of Bloomberg’s ESG solutions, please visit our website here.