This analysis is by Bloomberg Intelligence Equity Strategist Kumar Gautam. It appeared first on the Bloomberg Terminal.
Chinese stocks are least sensitive to rising rates while Indian equities face the highest risk in key emerging markets, according to our equities duration model. The model earmarks financial and health-care stocks with minimum and maximum duration risk, measured via an adaptation of Macaulay duration, which gauges equity portfolio rate sensitivity.
China, India at opposite ends of duration spectrum
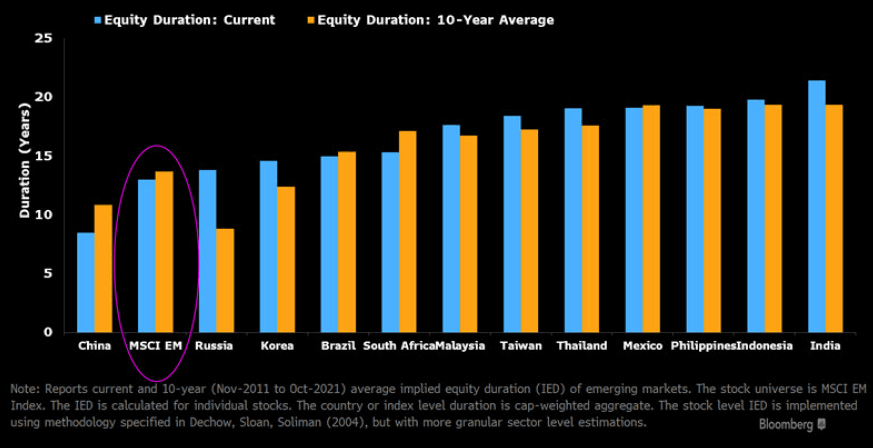
Our estimates of equity duration — a measure of price sensitivity to changes in discount rates — indicates that Chinese equities are among the least sensitive in key emerging markets. The Chinese stocks in MSCI Emerging Markets (EM) Index have an average duration of 8.5 years while India’s average 21.4 years. China’s current duration is below the 10-year average of 10.9 years while India’s exceeds its average of 19.4 years. The MSCI EM Index’s 13-year duration is close to its 13.7-year average.
Equity duration is an adaptation of Macaulay duration, a measure typically applied in fixed income. It involves computing company’s cash flow using return on equity and growth in book-equity forecasts, which are modeled as a mean-reverting autoregressive (AR) process. We estimate AR parameters at industry level.
Equity duration risk in emerging markets
Financials resilient; staples, health care may suffer
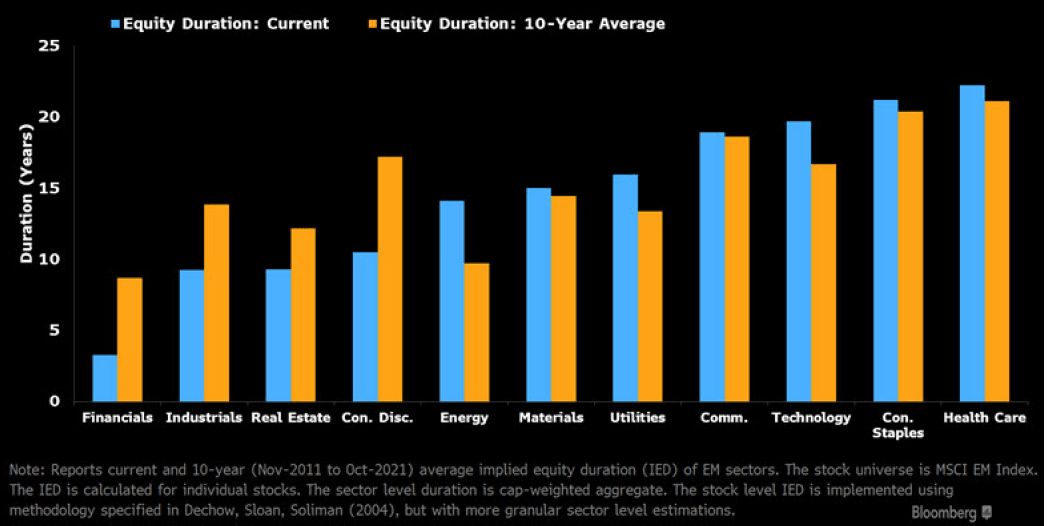
Financials stocks may be relatively resilient to rising discount rates, as indicated by their lowest duration among EM sectors. The average sector duration is 3.3 years vs. the MSCI EM’s 13-year average. The current duration is also below its 10-year average of 8.7 years. The industrial and real estate sectors also carry durations below the index average. Consumer staples and health care have durations as long as 20 years, exposing them to the vagaries of the rate cycle. These sectors have also shown high duration historically.
Duration numbers change depending on how we take averages at the sector level, giving equal or size-based weight to individual companies. The broad relative ranking remains the same.
Equity duration risk in EM sectors
Duration’s incremental information beyond value
Equity duration embeds information beyond valuation metrics, even if using them interchangeably is common practice. Valuations of high-duration stocks depend on estimates of long-term cash flows, making them more sensitive to changes in interest rates. This tendency also extends to some growth stocks. The principle also applies to low-duration and value stocks, valuations of which are more heavily weighted to near-term cash flows, making them less sensitive to rate shifts.
Our 10-year analysis of MSCI EM Index stocks shows the average rank correlation between earnings-to-price and duration is -72%, high but not perfect. Some valuation measures such as sales-to-price show even lower correlation of -50%, underscoring duration’s utility in assessing equity risk.
Rank correlation: Duration and other factors

Rate risk manageable via long-short strategy
Duration measures can be used to assess equity portfolios’ sensitivity to interest rate shifts. Our analysis of equities in India — where duration risk is highest among emerging markets — shows that a strategy taking long and short positions in low- and high-duration stocks, respectively, tends to perform better following positive changes in the yield curve. In the top 20% six-month periods with positive yield curve shifts, the strategy delivered a 9% higher average return. Conversely, the strategy’s average return in the bottom 20% six-month periods with negative yield curve change was 8% lower. The 17% performance gap spanning different rate environments shows that duration risk in equity portfolios can be managed by taking exposure to duration factor — positive and negative exposure for rate hike and drop.
Yield curve and duration: Indian case study

Duration to manage cash-flow risk
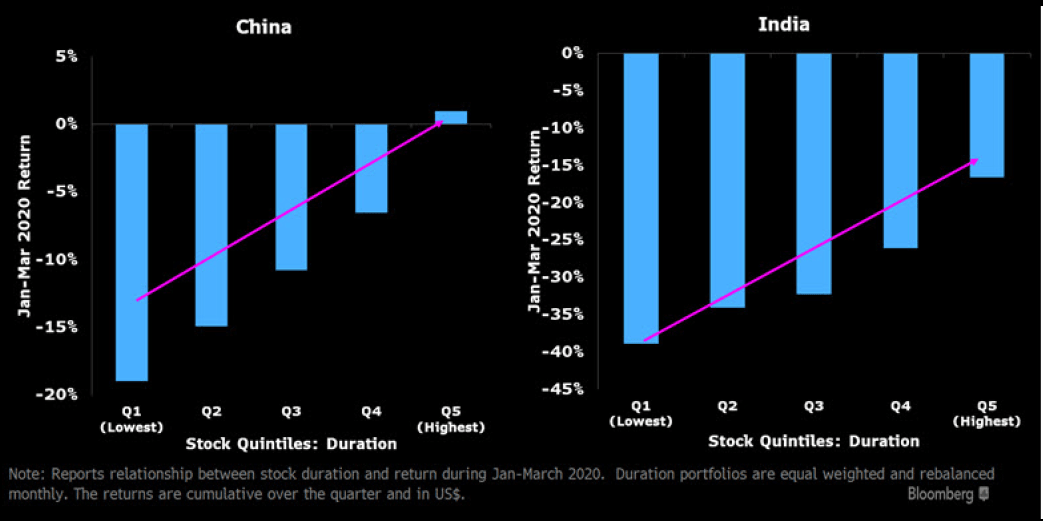
Our duration measures can also be used to manage portfolio risk arising from short-term cash-flow shocks, such as the one inflicted by the pandemic during 1Q20. Our analysis of Chinese and Indian equities, sitting at the extremes of the EM duration scale, shows that low-duration stocks with near-term cash flows were more impacted by the economic shutdown than their high-duration counterparts with cash flows far in the future. The lowest-duration Chinese stocks in the MSCI EM Index averaged a return of minus 19% for the quarter vs. a 1% return on high duration stocks, implying 20% underperformance. In the Indian market, returns on low- and high-duration stocks was minus 39% and minus 17%, again underperforming by more than 20%.
Duration and pandemic shock