Visualizations can be crucial for effectively sharing information with your team, or clients, about what’s happening with your portfolio. They can also potentially help you make timely investing decisions.
PORT Enterprise now enables you to create portfolio reports in Microsoft Power BI, which you can share as PDFs or dashboards. Power BI desktop is available for free and can be downloaded from Microsoft’s website. All versions starting with April 2021 come with the Bloomberg Data and Analytics connector preinstalled.
Underpinning this new reporting flexibility is BQL for PORT Enterprise. In effect it enables PORT Enterprise users to generate portfolio reporting datasets, hosted in the Bloomberg cloud, that can then be analyzed in Excel, BQuant, Power BI, and Tableau.
SO HOW does it work?
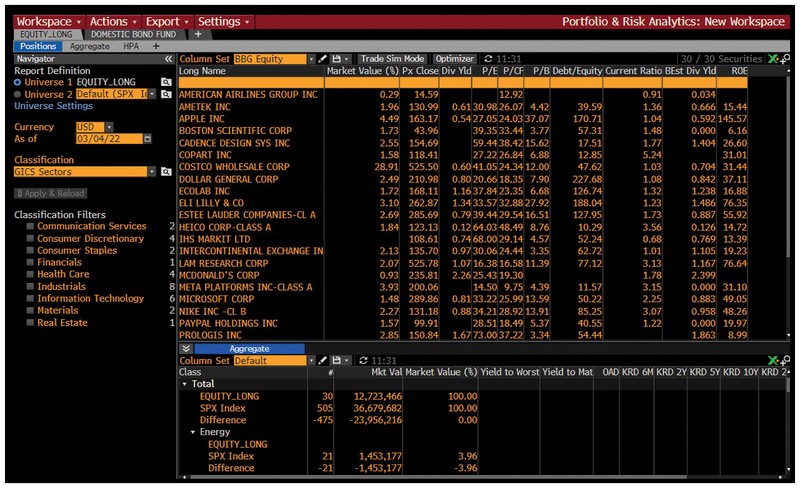
Let’s say you’ve loaded your portfolio via the Portfolio Administration (PRTU) function or automated uploads. Run {PORT <GO>} for the Portfolio & Risk Analytics function, and click the Workspace button on the red toolbar. Workspace is a new comprehensive portfolio analysis tool that lets you create reusable environments for performance analysis and risk forecasting.
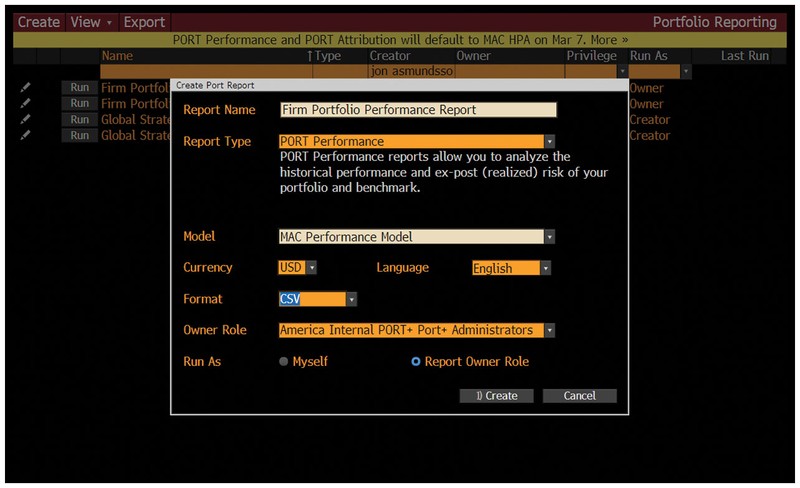
Great, so you’re a PORT Enterprise user and you’ve got your portfolio in PORT. Now you want to run a report. Go to {PREP <GO>}. Click the Create button on the red toolbar, and give your report a name. Use the Report Type drop-down to select a type such as PORT Performance, which lets you analyze historical performance and ex-post, or realized, risk of your portfolio and a benchmark. Use the Format drop-down to select CSV, for comma-separated values. Click the Create button to bring up the Portfolio Reporting: Editor screen, in which you will specify the details of your report template.
A series of steps, which you navigate using the sidebar on the left, lets you specify the particulars of your report. Click on the Analysis Context step. Here you can select a portfolio, a benchmark, a classification, and the period covered by the report. Click on Report Settings to specify how the report will display information, and choose settings for how it will handle look-through of funds and indexes.
The Fields step lets you choose the fields, including custom data items, that you want to generate in your report. When you’re done, hit Save and Close. Now you can run the report by clicking the Run button next to its name.
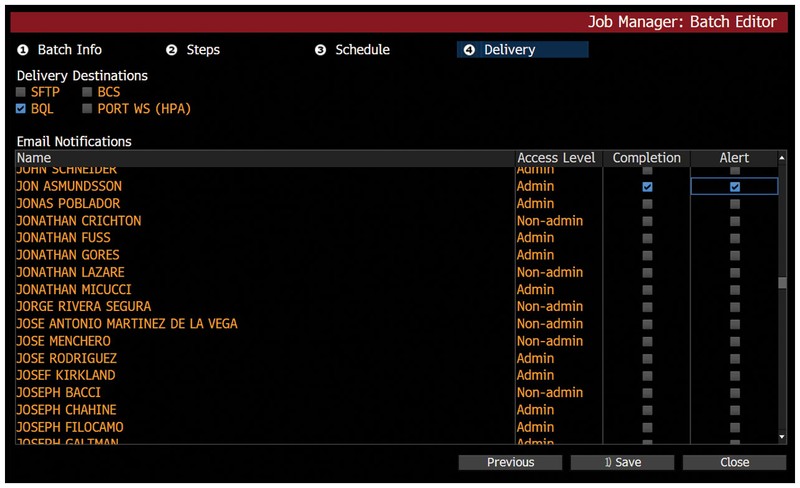
Once you’ve set up a report, the next step is to use the Job Manager (JMGR) function to generate a reporting batch job in BQL. To do that, run {JMGR <GO>} and click Create. The Job Manager: Batch Editor lets you set up the details of your batch job, which is a set of steps that automates the running of your report. Give the batch a name and hit Next. Choose Report from the Add drop-down, and select your report in the window that appears. Click on Schedule to specify when you want to run your batch. Click on Delivery, and tick the BQL checkbox to ensure that data in your report will be delivered in a format compatible with BQL. Once you’re done, click on Save and Close. To run your job, click the play button in JMGR.
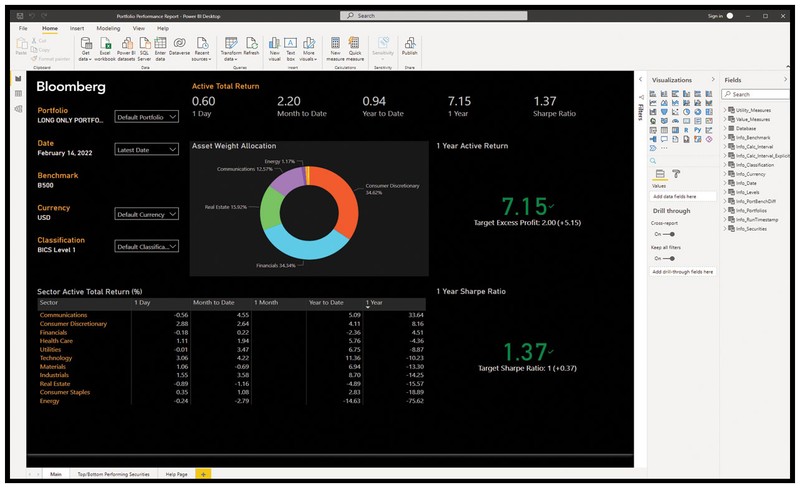
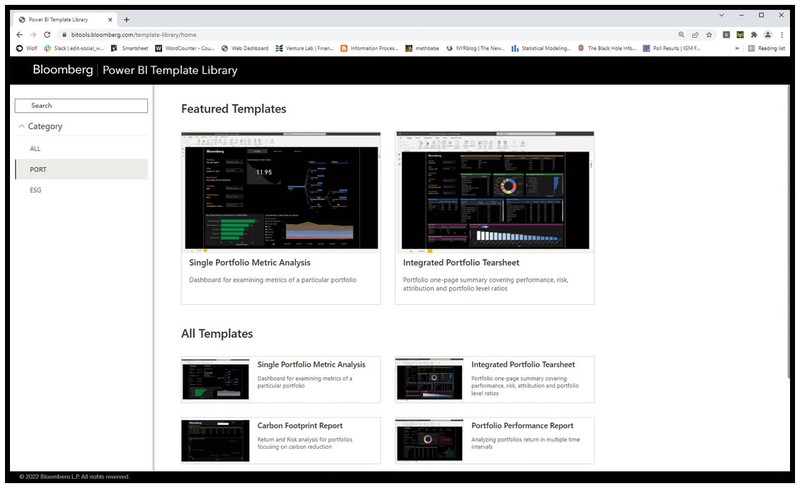
OK, NOW THAT you’ve generated a batch job in BQL, how do you tap into it in Power BI? Let’s look at some Bloomberg-curated templates for Microsoft Power BI. Run {BITL <GO>} to launch the Bloomberg Power BI Template Library in your browser. Click on a template to select it. To open it in Power BI, use the drop-downs to select a portfolio and report, then hit the Download button.
In Power BI, hit the Refresh button. Click on Sign in in the Bloomberg Data and Analytics pop-up window, and enter your credentials in the subsequent Login screen. Then click the Connect button. Your PORT data will now be imported into Power BI. Once the data is fully imported, you will be able to use the visuals in the dashboard to analyze your portfolio.
This brief walk-through only scratches the surface of what you can create with BQL for PORT Enterprise data. For more info, contact your PORT Enterprise representative.
Cosereanu is a portfolio and workflow specialist at Bloomberg in New York. Yu and Zweig are on the Reporting Apps engineering team, also in New York.