ARTICLE
Data Spotlight: Impact of lower AI costs, tick data & more

Bloomberg Professional Services
This article was written by the Bloomberg Enterprise Investment Research Data team: Jerome Barkate, Frances Shi and Maris Serzans.
Welcome to Data Spotlight, our series showcasing insights derived from Bloomberg’s 8,000+ enterprise datasets available on data.bloomberg.com via Data License.
In this edition we focus on how investors can use equity pricing point-in-time data, industry segments, and short positioning insights to uncover risks and opportunities related to market events, such as the entrance of the new AI industry player. We also showcase how effective and consistent Transaction cost analysis (TCA) can be done using the Bloomberg tick history data.
Looking for our other data-related findings? Explore these recent articles from the Data Spotlight series:
- Broader industry analysis & more
- Supply chain data & AI-based news insights
- Intraday trading & market volatility
For more articles in this series click here.
1. Assessing impact of lower AI cost on companies with pricing point-in-time
DeepSeek, a Chinese AI startup, has developed AI models that reportedly offer comparable performance to well-known chatbots at a fraction of the development cost. As DeepSeek platform gains traction, investors looking at the AI space need to understand the implications of the entrance of this new player.
One way to identify companies that might be impacted by this event is to analyze market reaction on the day of the DeepSeek’s announcement. We can do so by using Equity Pricing Point-in-Time to replay the period and measure abnormal volume activity as well as maximum drawdown on the period.
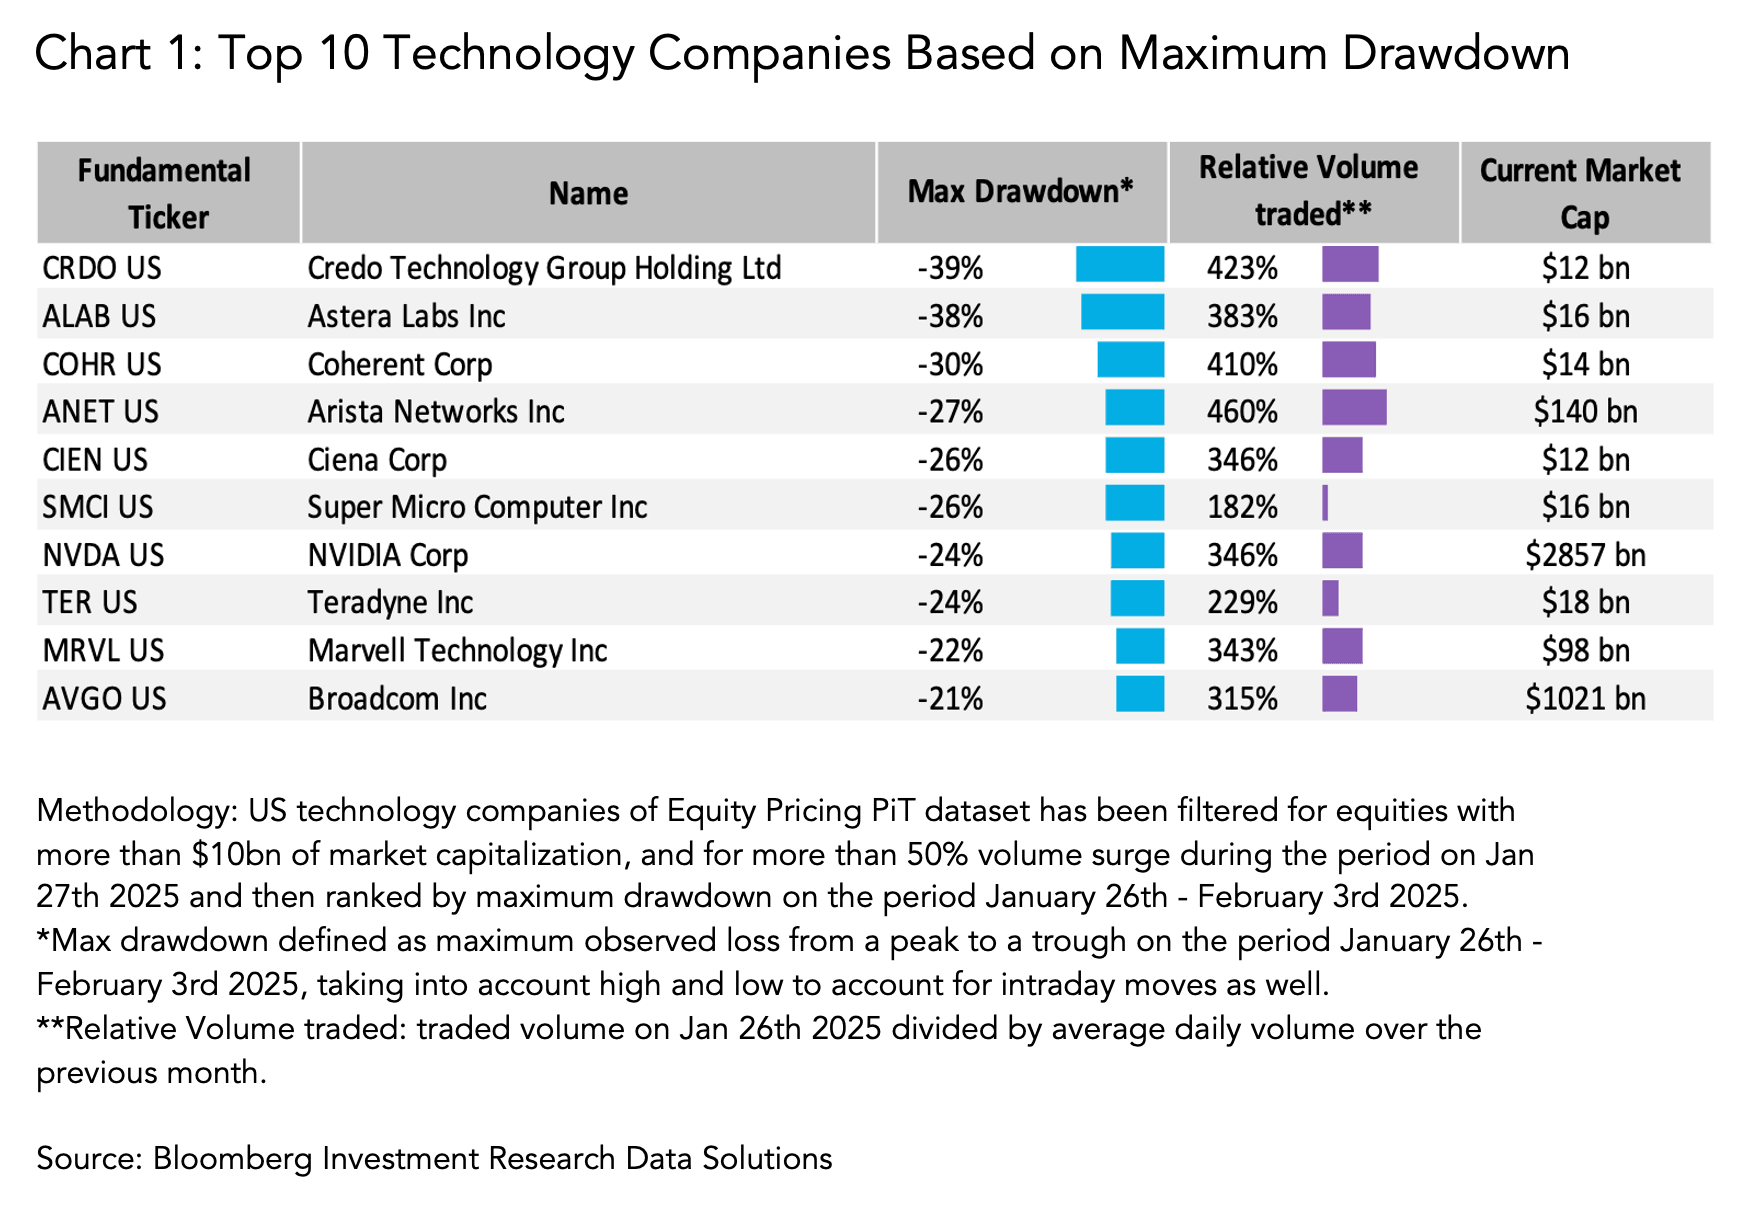
In our study, we defined a volume surge as a volume on a day that is larger than 150% of the average daily volume of the past month. We also considered a maximum drawdown of more than 10% as a significant indicator of market impact. By applying these criteria, we came up with a list of stocks impacted by DeepSeek’s announcements. In Chart 1, we identified top 10 technology companies impacted by the announcement, as measured by market reaction to the news. The list of companies includes Nvidia, a semiconductor company that has been fueled by the recent boom in AI spending.
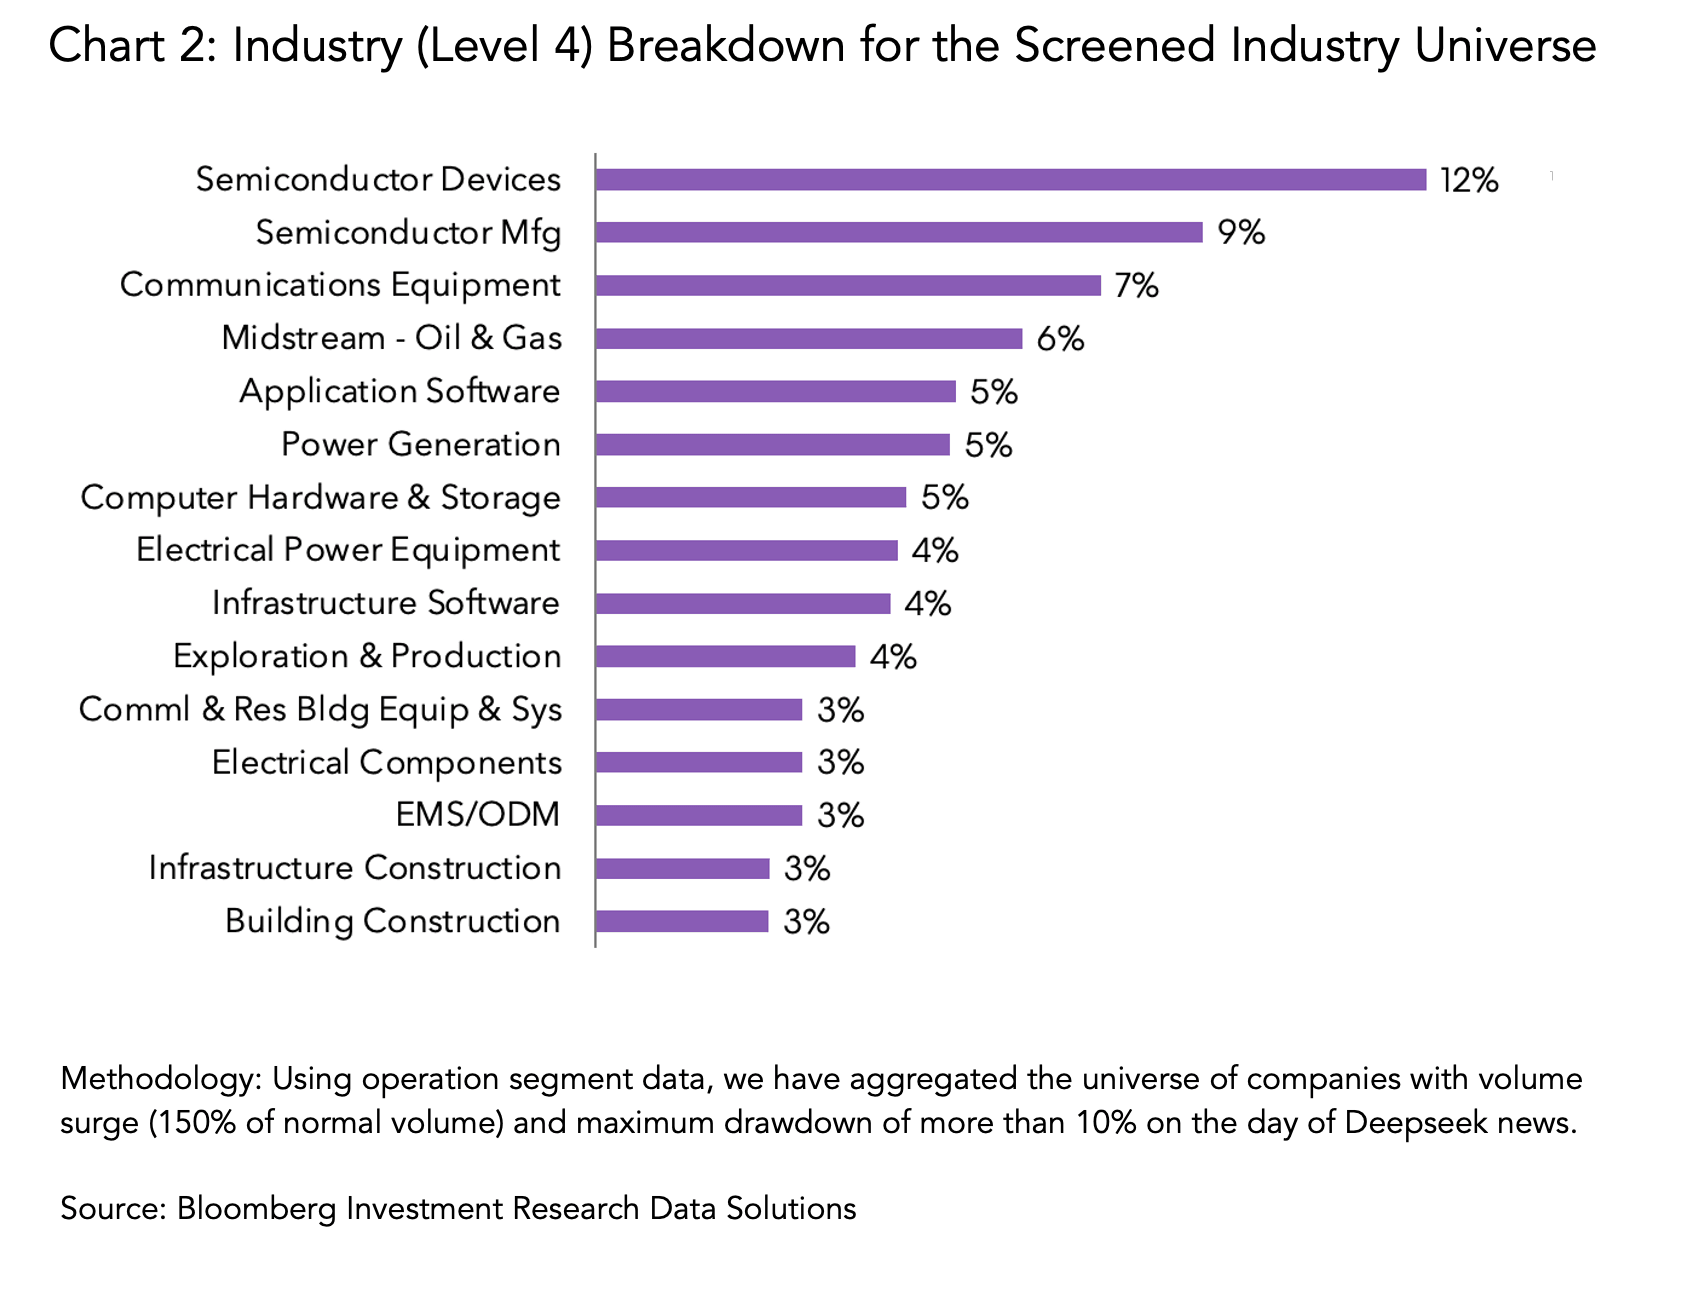
To gain a deeper understanding of the companies impacted by DeepSeek’s announcement, we can combine our findings with Bloomberg Operating Segment Fundamentals dataset. This dataset provides a breakdown of revenue by industry of more than 55,000 companies. By analyzing the affected set of companies’ Bloomberg Industry Classification System (BICS) level 4 classification, we found that companies involved in semiconductors are well represented in this universe. This industry is a key component for AI investments and its performance is positively correlated to the cost of running AI models, as illustrated in Chart 2.
By analyzing the market reaction to DeepSeek’s announcements and combining this data with operating segment fundamentals, investors can gain a deeper understanding of the landscape as the new developments emerge.
Themes: Equity Screening, Thematic Investment
Roles: Quants, Portfolio Managers, Risk Managers, Equity Analysts
Bloomberg Datasets: Equity Pricing Point-in-Time, Operating Segment Fundamentals
2. Using equity positioning to get market insights
The property crisis and economic slowdown in China in recent years lead to the local stock market rout in 2024 resulting in a Chinese stock market having a Price-to-Earnings ratio of 10.8x for the Hang Seng Index as of February 19, 2025. By comparison, the Bloomberg World Large and Mid Cap Index at that time was 20.7x.
However, the rise of DeepSeek could potentially lead investors to re-evaluate the potential growth of Chinese companies, adjusting their valuations based on the emerging role of AI and other advanced technologies in shaping the future economy. A way to observe sentiment change from investors is by measuring the evolution of short positioning: a reduction of short positions on stocks indicates more appetite from equity investors for a given company, sector or market.
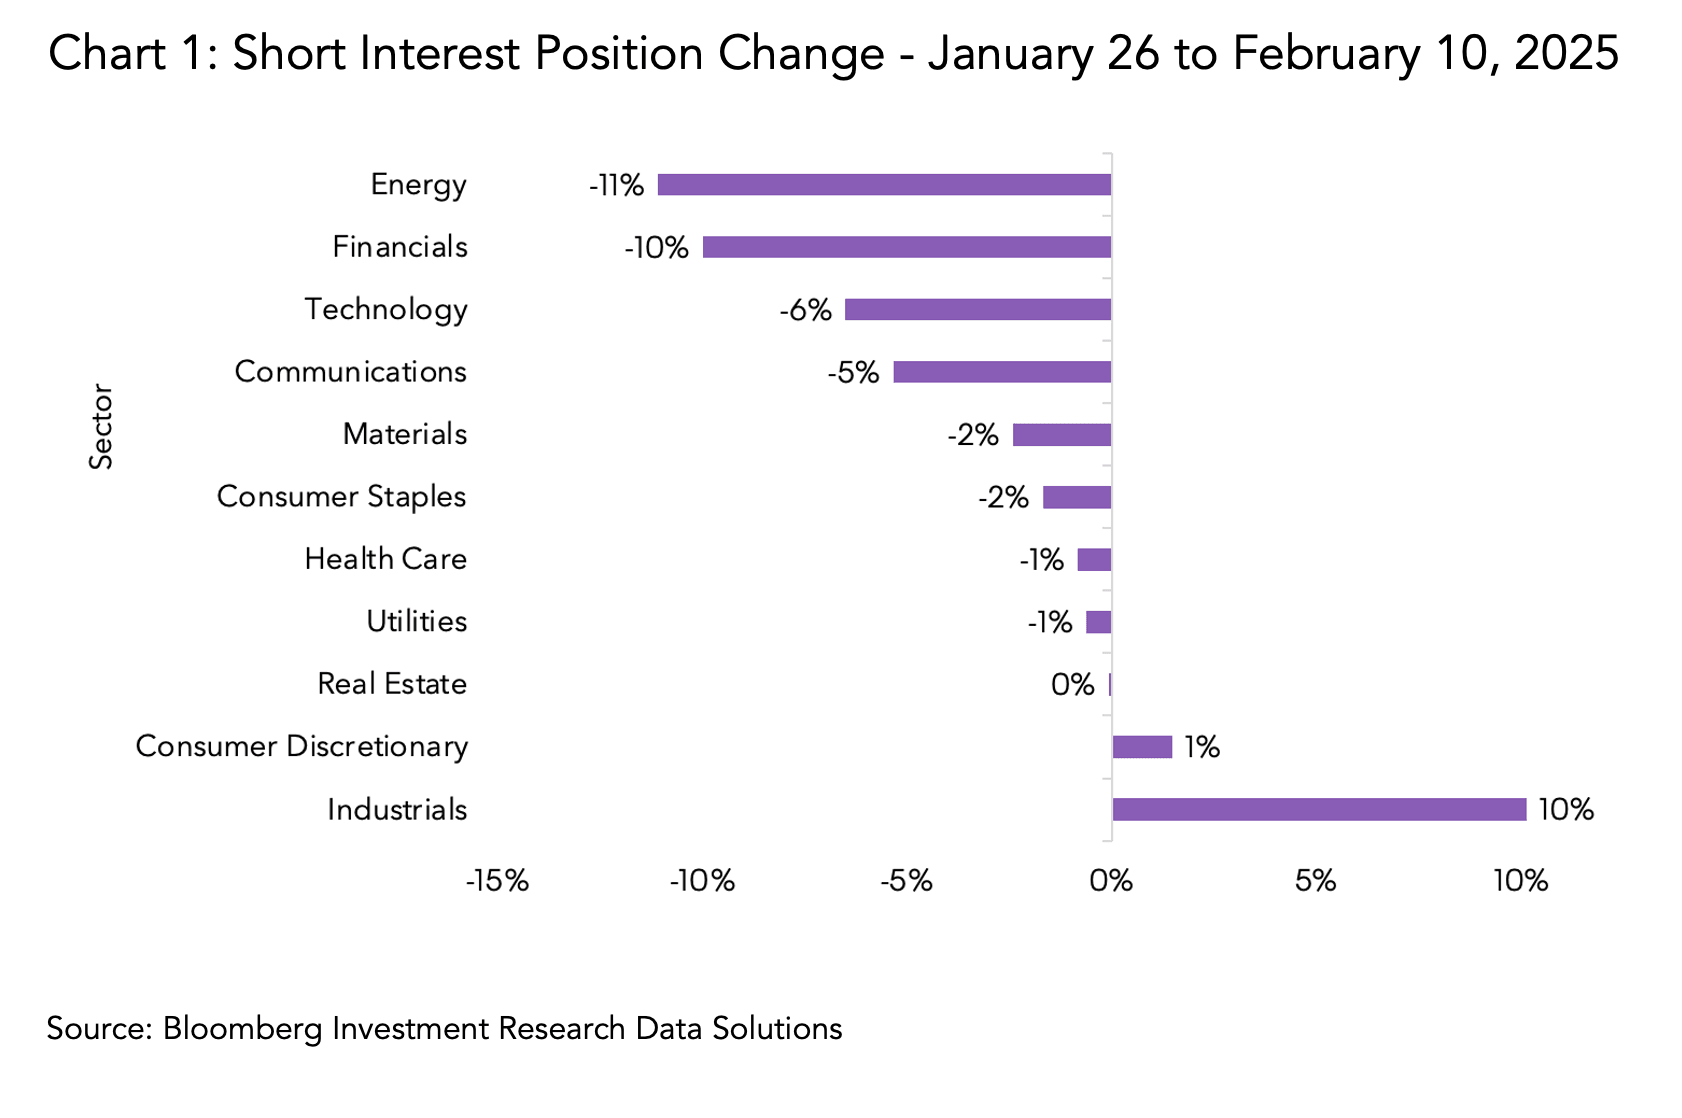
Looking at S3 Partners Short Interest Data for Hang Seng Index constituents since the release of DeepSeek on January 26 (Chart 1), it could be seen that Short Interest positions are consistently decreasing especially for Energy, Financials and Technology sectors.
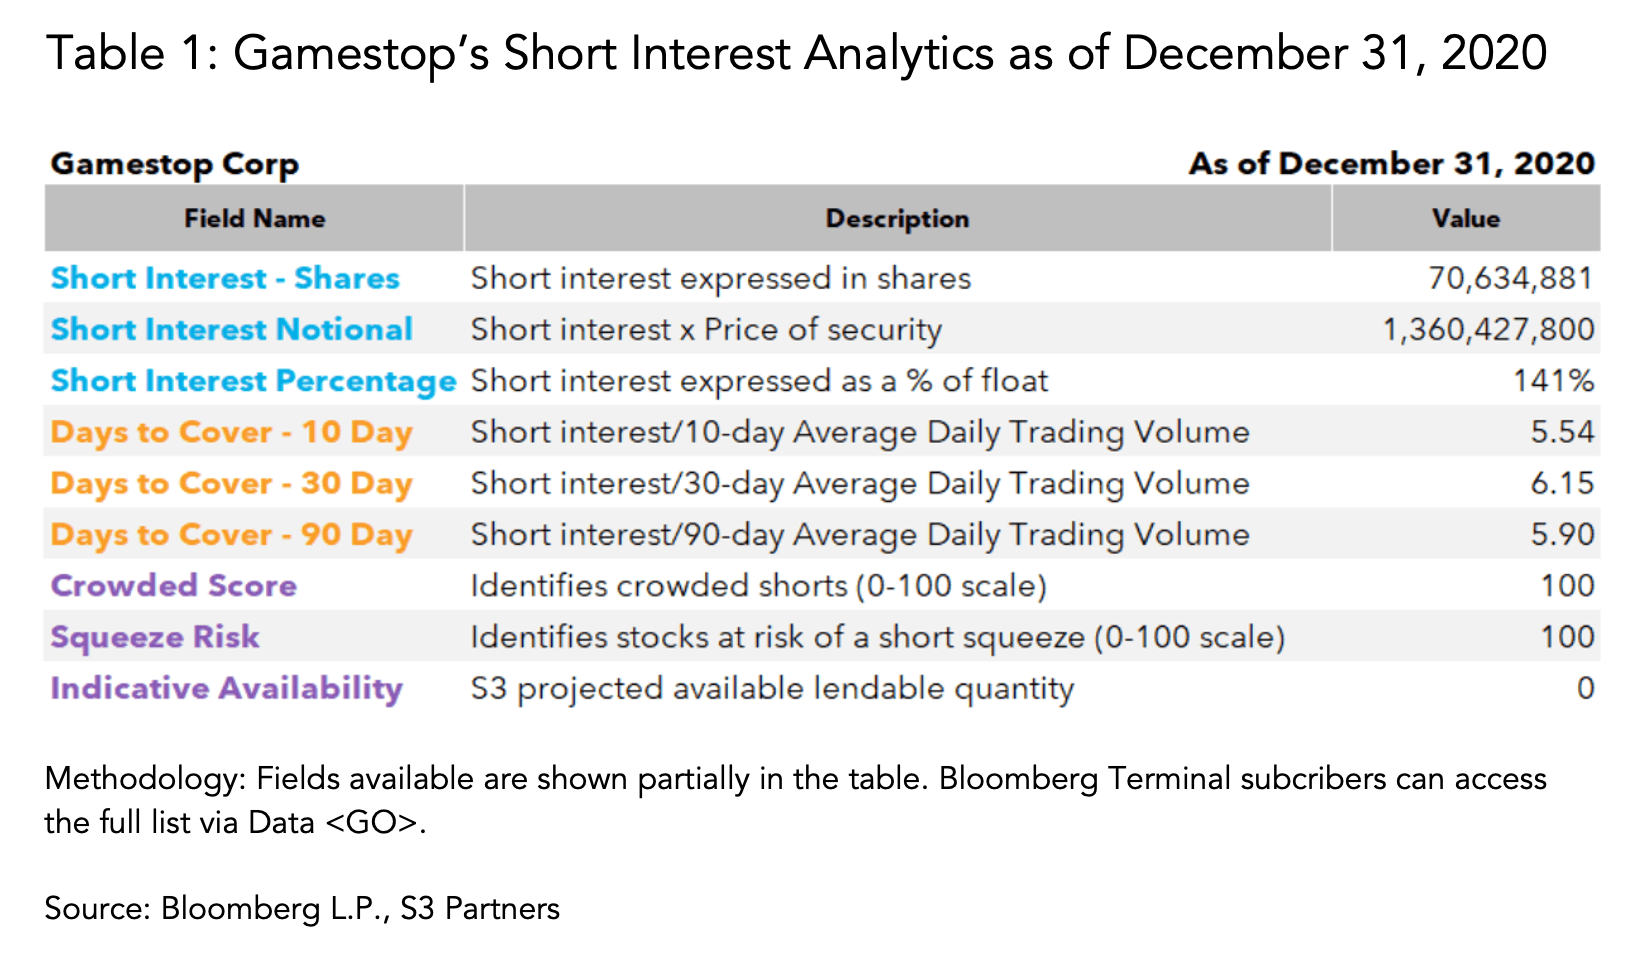
Looking at another example of using equity positioning to get market insight, let’s zoom in on Gamestop. The video game retailer, which experienced a major short squeeze event in January 2021. As of December 31, 2020, it had around 141% of shares available for trading sold short, making it top 10 mostly heavily-shorted stocks out of the 18,000 stocks traded in US exchange that are covered in our stock universe.
S3 Short Interest Data also provides other shorting activity related metrics. For example, it would have taken more than 5 days to cover the short interest amount of Gamestop if measured by past average daily trading volume. The other two predictive analytics – Squeeze Risk Score as well as Crowded Score – both stand at 100, indicating Gamestop faced the highest level of risk at the time, as of December 31st 2020 (Table 1).
Themes: Equity Screening, Risk Management, Trading
Roles: Portfolio Managers, Traders, Analysts
Bloomberg Dataset: S3 Partners Short Interest Data
3. Utilizing tick data for best execution: AI precision approach to solving transaction cost analysis
Transaction cost analysis (TCA) is a method used by institutional investors, asset managers and traders to evaluate both implicit (commission and fees) and explicit (market impact, slippage) costs associated with executing trades. More requirements are needed, such as the Packaged retail and insurance-based investment products (PRIIPs) regulation which focuses on enhancing investor protection and requires financial institutions to perform TCA.
Using the Bloomberg Tick History product we can retrieve tick data for specific timestamps to analyse the effectiveness of executed trades. Notably, Bloomberg’s tick data has high granularity, comprehensive market coverage, consistency across markets through data normalization and trade metadata (like condition codes).
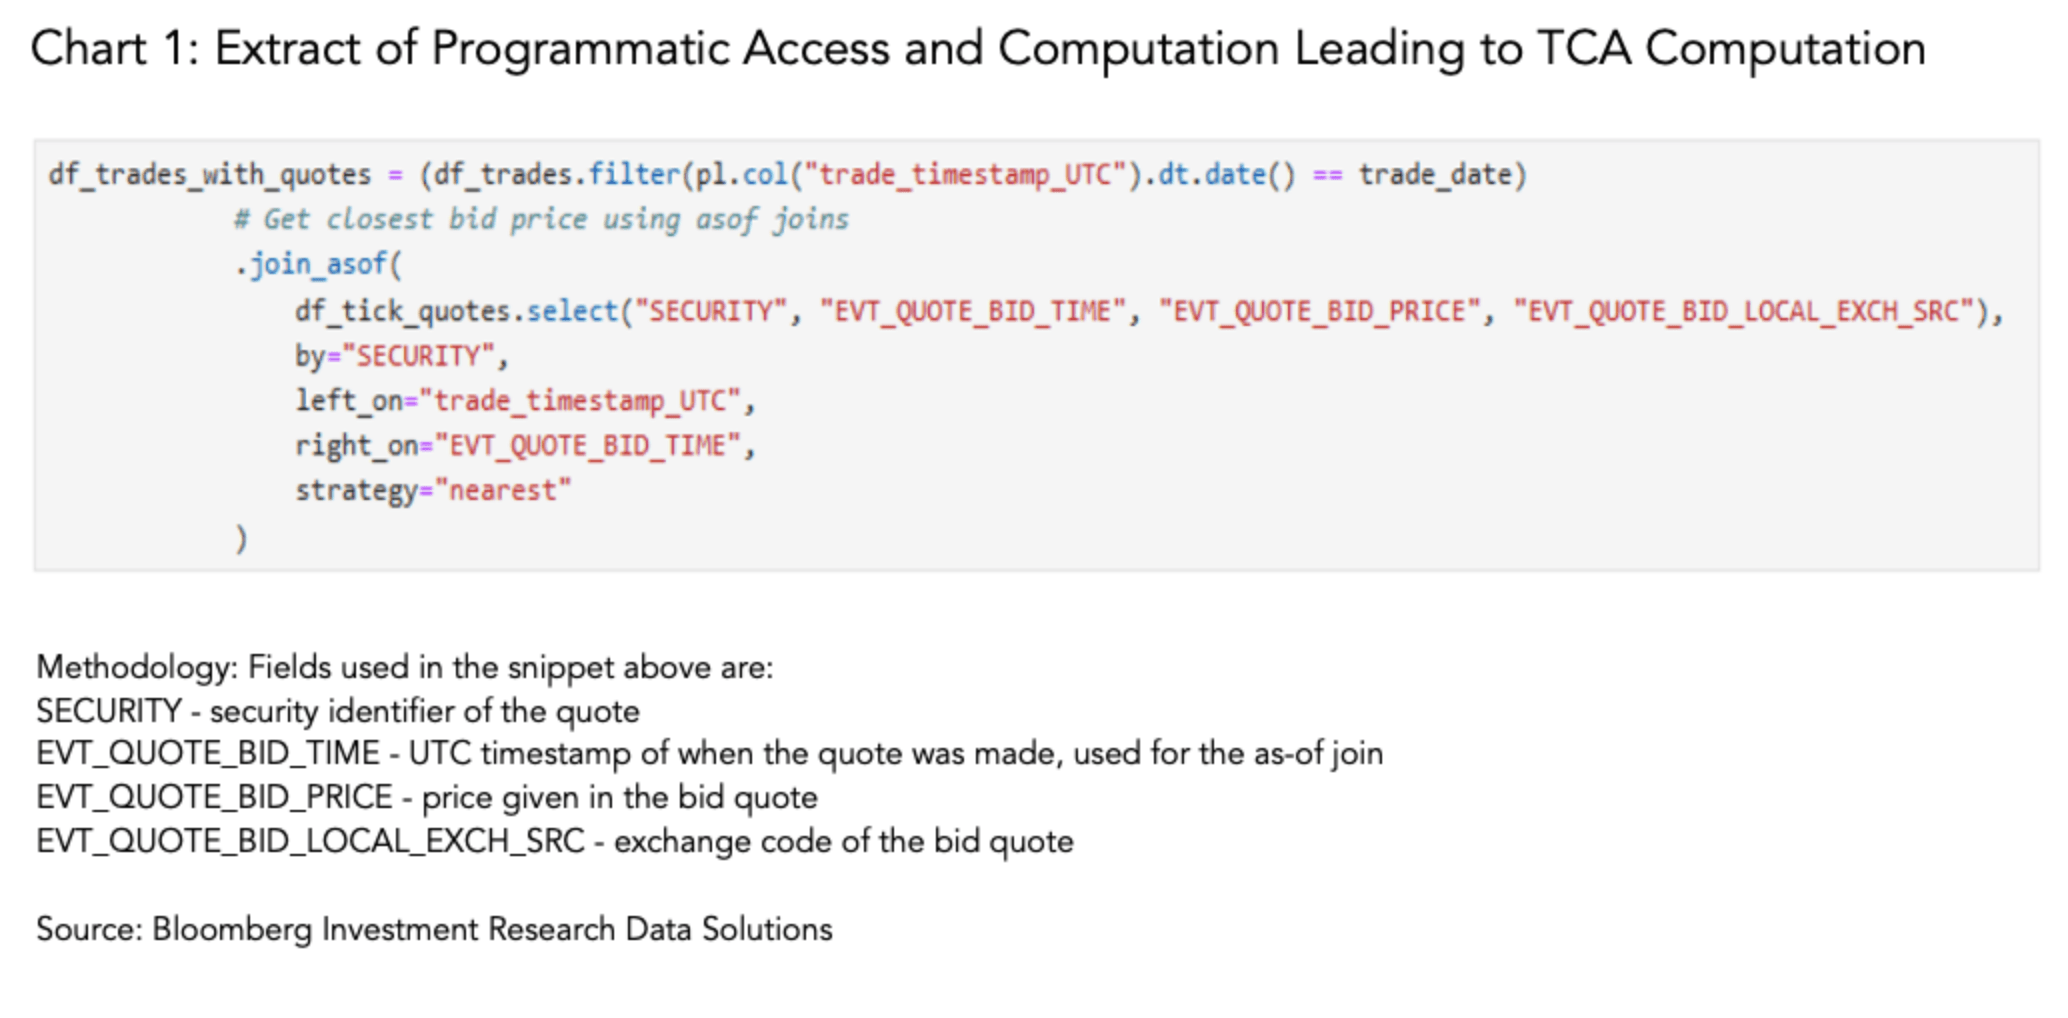
To conduct TCA analysis, we can programmatically download data using Bloomberg REST API. To conduct TCA analysis, we may use Bloomberg REST API to download the data programmatically. As illustrated in the code snippet below (Chart 1) combining an executed trade with quotes (level1*) can be done by using as-of joins to get the nearest quotes and determine the cost of execution.
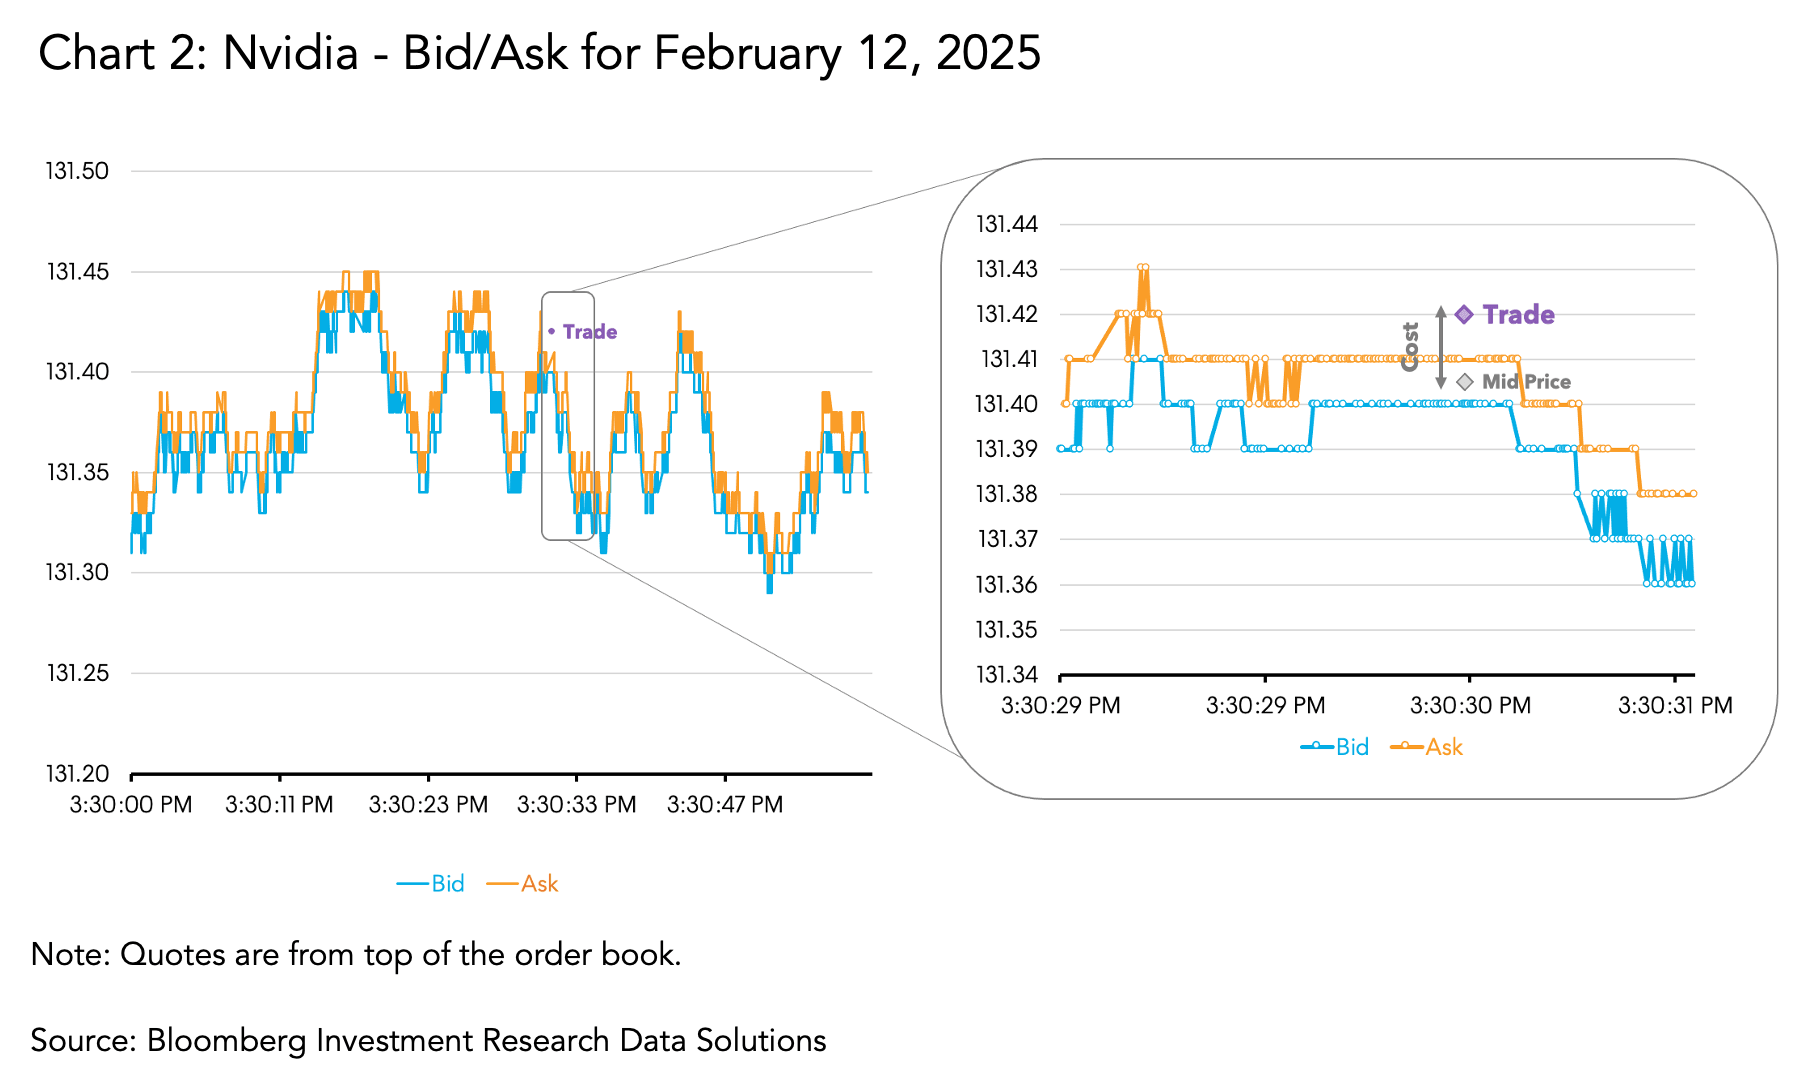
As illustrated in Chart 2, all the necessary high resolution tick data to run TCA is available ensuring traceability and transparency throughout the process. Firms can pinpoint discrepancies in pricing, assess market impact and confirm adherence to best execution standards mandated by regulatory bodies.
In conclusion, to accurately run transaction cost analysis, analysts must be able to collect and process large amounts of granular data. Bloomberg data can be used for transaction cost analysis given its breadth, depth, and accuracy. With access to real-time market data, historical trading records, and advanced analytics tools, Bloomberg provides a comprehensive platform for analyzing transaction costs and optimizing trading strategies.
Themes: Alpha generation, Risk management
Roles: Portfolio Managers, Analysts, Risk Managers
Bloomberg Datasets: Company Financials, Estimates and Pricing Point-in-Time, Supply Chain
Interested in learning more about our data offering? Bloomberg’s Enterprise Investment Research Data product suite provides end-to-end solutions to power research workflows. All of these data solutions are interoperable and can be seamlessly connected with other datasets, including alternative data, and are available through a number of delivery mechanisms, including in the Cloud and via API. More information on these solutions can be found here.
Bloomberg Data License provides billions of data points daily spanning Reference, ESG, Pricing, Risk, Regulation, Fundamentals, Estimates, Historical data and more to help you streamline operations and discover new investment opportunities. Data License content aligns with the data on the Bloomberg Terminal to support investment workflows consistently and at scale across your enterprise.
The data included in these materials are for illustrative purposes only. The BLOOMBERG TERMINAL service and Bloomberg data products (the “Services”) are owned and distributed by Bloomberg Finance L.P. (“BFLP”) except (i) in Argentina, Australia and certain jurisdictions in the Pacific Islands, Bermuda, China, India, Japan, Korea and New Zealand, where Bloomberg L.P. and its subsidiaries (“BLP”) distribute these products, and (ii) in Singapore and the jurisdictions serviced by Bloomberg’s Singapore office, where a subsidiary of BFLP distributes these products. BLP provides BFLP and its subsidiaries with global marketing and operational support and service. Certain features, functions, products and services are available only to sophisticated investors and only where permitted. BFLP, BLP and their affiliates do not guarantee the accuracy of prices or other information in the Services. Nothing in the Services shall constitute or be construed as an offering of financial instruments by BFLP, BLP or their affiliates, or as investment advice or recommendations by BFLP, BLP or their affiliates of an investment strategy or whether or not to “buy”, “sell” or “hold” an investment. Information available via the Services should not be considered as information sufficient upon which to base an investment decision. The following are trademarks and service marks of BFLP, a Delaware limited partnership, or its subsidiaries: BLOOMBERG, BLOOMBERG ANYWHERE, BLOOMBERG MARKETS, BLOOMBERG NEWS, BLOOMBERG PROFESSIONAL, BLOOMBERG TERMINAL and BLOOMBERG.COM. Absence of any trademark or service mark from this list does not waive Bloomberg’s intellectual property rights in that name, mark or logo. All rights reserved. © 2025 Bloomberg.