ARTICLE
Earnings are crushing it – Here’s why it’s not helping stocks

Bloomberg Professional Services
This analysis is by Bloomberg Intelligence Chief Equity Strategist Gina Martin Adams and Equity Strategy Data Analyst Wendy Soong. It appeared first on the Bloomberg Terminal.
Fourth-quarter earnings are on pace to significantly exceed earnings estimates across capitalizations — nearly doubling the preseason forecasts — but it hasn’t been enough to satisfy investors as stocks are responding with unusually sour returns. Disappointments in guidance, revisions and operating margin all share the blame. Nvidia could still move the needle as the large-cap season wraps up next week.
Mega caps might still move the needle
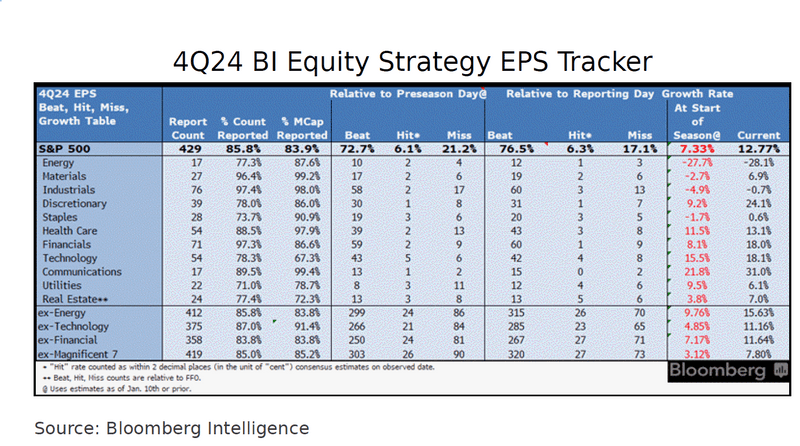
While Nvidia’s report may still sway the ultimate 4Q result, with more than 86% of companies and the 84% market cap of the S&P 500 reported, companies are outpacing expectations with growth of 12.8% vs 7.3%, or 15.6% vs. 9.3% when excluding energy. Energy and industrials are the only sectors expected to decline this quarter, while staples and materials defied expected losses. Discretionary outperformed the most, with 24.1% growth (vs. 9.2%), but mostly because of Amazon.com. Excluding the retailer, it managed a mere 2.1% growth.
Beat rates are lower than average: 76.5% of reports exceeded EPS estimates vs. the post-pandemic average of 78.4%. During last week, Hasbro and EQT topped estimates the most, while CoStar and International Flavors & Fragrances disappointed. Live Nation reported an unexpected profit.
Sales growth is hitting expectations
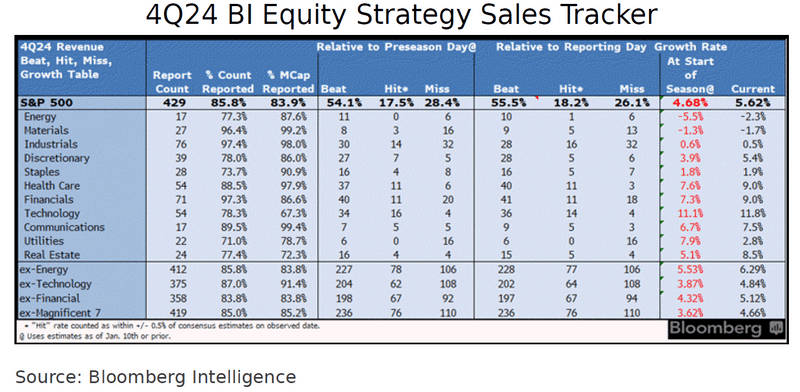
Index sales have been abnormally difficult for analysts to predict since Covid, but the S&P 500sales forecast was close to spot-on this season. Top-line expansion is on pace to beat expectations by 94 bps at 5.62% growth vs. the 236 bps average spread between predictions and reality in the post-Covid environment and 61 bps in the five years before Covid. Energy and materials are the only sectors to report declines. Real estate and energy are on track to beat expectations by the most, with utilities missing by the largest margin. 55.6% of companies exceeded estimates (vs. the62.3% average post-Covid), while 26.2% missed forecasts (vs. 23.9% average).
In the last 10 days, Devon Energy and Exelon had the biggest upside surprises, while Constellation Energy and NiSource missed expectations by the widest margins.
Energy spoiled the margin mood
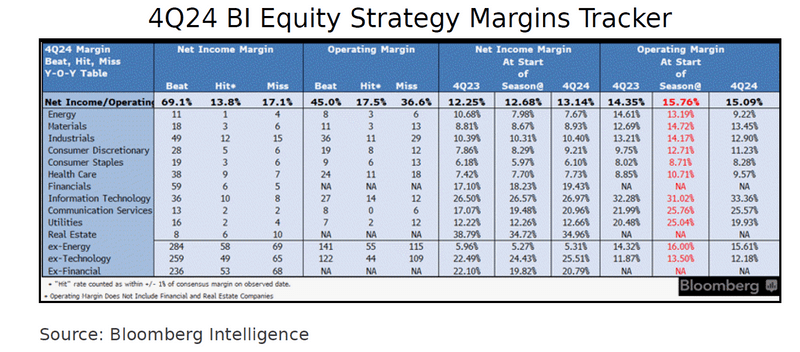
Divergent results for margins continued in 4Q, with net income margins above the preseason forecast while operating margins missed the mark, indicating operating costs remain a challenge. Index net income margin outpaced preseason forecasts by 46 bps at 13.14%, and operating missed by 66 bps at 15.09%. All 11 sectors beat the net income margin forecast except for energy, while information technology is the only sector out of nine (excluding financial and real estate) that topped the operating margin forecast. Four out of nine sectors are likely to expand both margins from a year ago, led by communications services and discretionary.
69.1% of companies reported higher-than-expected net income margins (vs. three-year average of64.6%), while only 45% topped the operating margin forecast (vs. 52% average).
Market generally sold the good earnings news
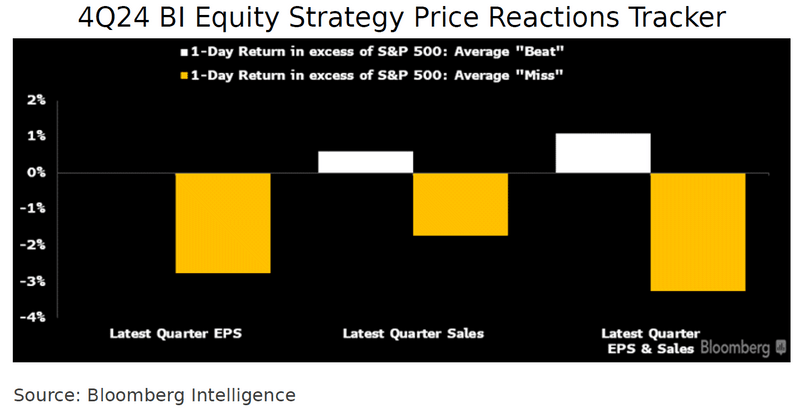
Despite better-than-expected results, average price reactions to earnings were worse than normal this season. For companies that beat expectations on EPS, sales or both, the average excess one-day price returns were -0.02%, 0.59% and 1.09%, below the historical average for gains of 0.68%,0.89% and 1.26%, respectively. Companies that missed on the bottom or top lines, or both, slid more than the index by 2.76%, 1.73% and 3.25% vs. historical average declines of 2.23%, 1.64%and 3.24%.
Among the companies that reported the last two weeks, MGM Resorts and CVS Health advanced the most, while West Pharmaceutical and Celanese had the steepest declines.
Russell 2000 is easily beating preseason forecasts
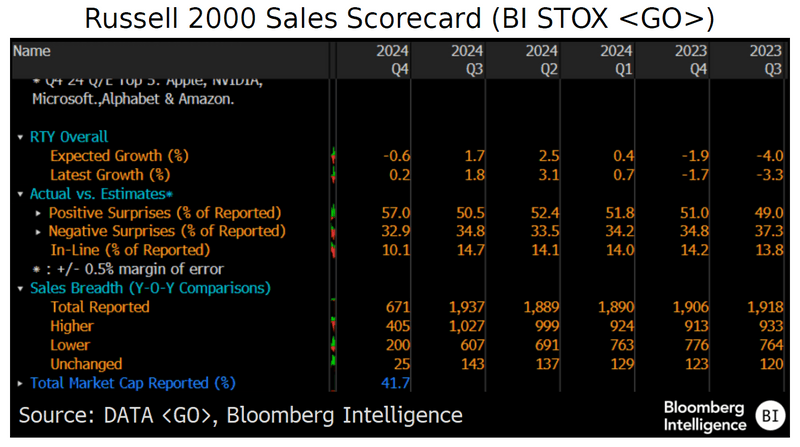
With 41.7% of its members having reported, the Russell 2000 is poised to beat the preseason revenue growth forecast by a sound margin. So far, the small-cap gauge is set for a 0.2% top-line gain, based on current constituents, vs. the preseason outlook for a drop of 0.6%. However, the most encouraging result is the beat rate — 57% of companies have cleared their preseason hurdles, which would be the highest since 1Q23. The average beat rate, going back to 2013, is53.4%,
Small-cap communications (72.7%), staples (63.6%) and materials (60.7%) have exceeded estimates most frequently. Energy (17.7%), utilities (33.3%) and health care (47.5%) have the lowest percentage of companies topping forecasts to date.
Guidance momentum remained negative for 1Q
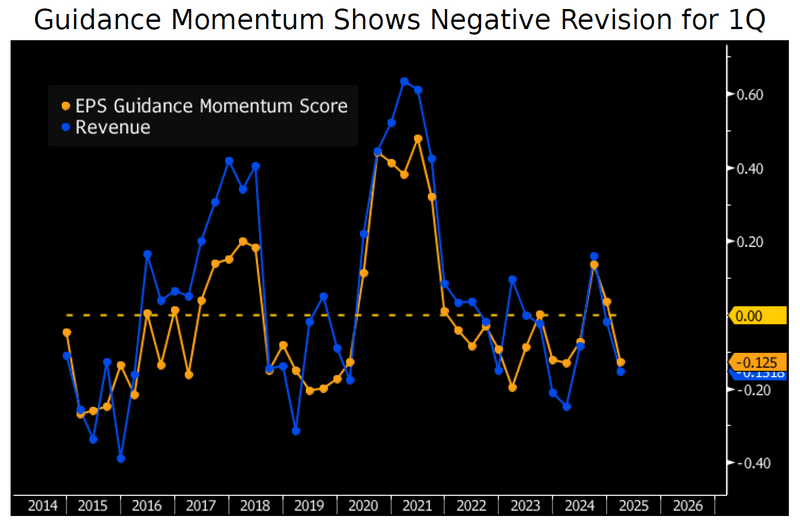
After a brief period in positive territory the last two quarters, our next-quarter EPS guidance momentum score fell back into negative territory. The EPS score (higher revisions minus lower, plus half of neutral, divided by the total) is minus 0.13, worse than the five-year pre-pandemic averag eof minus 0.08, and the minus 0.15 revenue score is short of the 0.00 average.
So far this year, 213 companies provided guidance, and six, including Howmet Aerospace, F5 and Tapestry, released both EPS and revenue views that were higher than analyst consensus. Meanwhile, 27 constituents released disappointing outlooks for both, including Intel, Zoetis and Honeywell.
EPS and revenue revisions continue to sour the mood in 2025
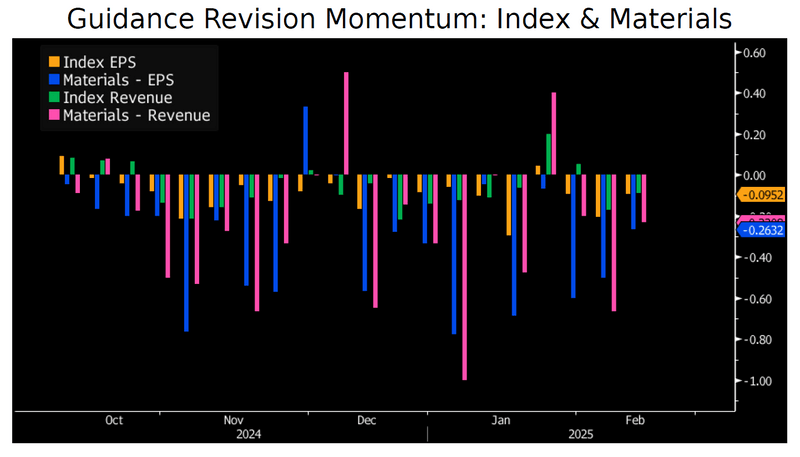
The S&P 500’s 12-month forward EPS estimate revision momentum (positive minus negative revisions divided by the total) has worsened with the 4Q earnings season, and now has been negative in 26 out of the last 28 weeks. Sales revision momentum was slightly better but has decreased in 20 of those weeks. The net revision momentum tends to be negative on average, but scores for the last three months were below average, showing more deterioration in forecasts than is normal. Among sectors, materials is worst with EPS revision momentum in the red for 24 weeks. Energy has had more positive revisions in recent weeks but is also still struggling overall.
Financials is the only sector with positive momentum scores in EPS and revenue in the last 28 weeks.
The data included in these materials are for illustrative purposes only. The BLOOMBERG TERMINAL service and Bloomberg data products (the “Services”) are owned and distributed by Bloomberg Finance L.P. (“BFLP”) except (i) in Argentina, Australia and certain jurisdictions in the Pacific Islands, Bermuda, China, India, Japan, Korea and New Zealand, where Bloomberg L.P. and its subsidiaries (“BLP”) distribute these products, and (ii) in Singapore and the jurisdictions serviced by Bloomberg’s Singapore office, where a subsidiary of BFLP distributes these products. BLP provides BFLP and its subsidiaries with global marketing and operational support and service. Certain features, functions, products and services are available only to sophisticated investors and only where permitted. BFLP, BLP and their affiliates do not guarantee the accuracy of prices or other information in the Services. Nothing in the Services shall constitute or be construed as an offering of financial instruments by BFLP, BLP or their affiliates, or as investment advice or recommendations by BFLP, BLP or their affiliates of an investment strategy or whether or not to “buy”, “sell” or “hold” an investment. Information available via the Services should not be considered as information sufficient upon which to base an investment decision. The following are trademarks and service marks of BFLP, a Delaware limited partnership, or its subsidiaries: BLOOMBERG, BLOOMBERG ANYWHERE, BLOOMBERG MARKETS, BLOOMBERG NEWS, BLOOMBERG PROFESSIONAL, BLOOMBERG TERMINAL and BLOOMBERG.COM. Absence of any trademark or service mark from this list does not waive Bloomberg’s intellectual property rights in that name, mark or logo. All rights reserved. © 2025 Bloomberg.