
Bloomberg Professional Services
This article was written by Antonios Lazanas, Head of Portfolio, Index and Sustainability Quant Research, and Changxiu “Sue” Li, Product Manager, Fixed Income Portfolio Analytics at Bloomberg.
Uncertainty about US trade policy has brought significant turbulence to financial markets worldwide. This paper aims to review the recent performance of fixed income and equity markets and provide guidance on how to utilize PORT portfolio modelling tools to position portfolios for a potential recession. The PORT tools used in this study include MSR (market structure report), MAC HPA (performance attribution), MAC3 GRM (risk model) and FBS (factor-based scenario) analysis.
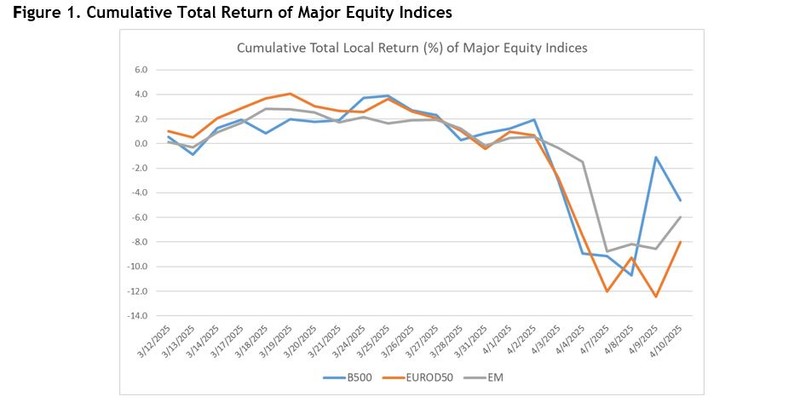
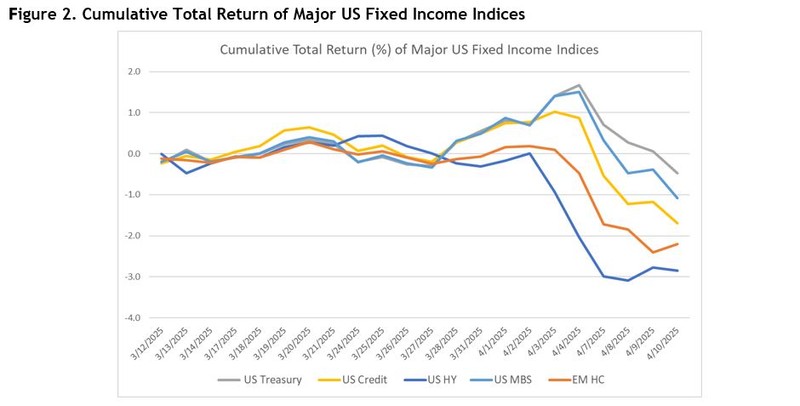
Before diving into the performance, analytics, risk forecasts and scenario analysis, let us recap what has happened during the past few weeks. On April 2nd, the US government announced its new reciprocal tariff policy that substantially increased the tariffs imposed on goods imported into the United States. The new policy prompted reciprocal tariffs from trading partners triggering a global stock market selloff from April 3rd to 8th. On April 9th, the US government announced a 90-day tariff suspension for most countries. The announcement was followed by a dramatic rally in US equities, which posted the largest daily percentage gain since 2009. US Treasuries initially rallied on April 3rd and 4th upon the initial equity market meltdown but with emerging concerns over potential disposals of US long term debt from foreign central banks, US Treasuries tumbled with long-term yields rising more than 50 basis points from April 7th to April 11th. Both equity and fixed income markets stabilized and reversed afterwards.
Performance of major indices
Figure 1 shows the daily return of major global equity indices. The stock market selloff started on April 3rd for B500 Index (which closely mirrors the performance of the SPX Index) followed by a market reversal on April 9th. To put this into context, the B500’s -4.83% daily return on April 3rd is a 5.3 standard deviation event based on the ex-ante risk forecast of the MAC3 Daily model.
On the fixed income side, high-yield and emerging markets indices mirrored the equity markets, whereas higher quality indices were driven primarily by interest rates. In particular, the US High Yield Index dropped by 0.94% on April 3rd, much less than equities, but still a 5 standard deviation move relative to the risk prediction of the MAC3 Daily model. The US Treasury, US MBS and US Investment Grade Credit indices all posed gains on April 3rd and 4th, but registered large losses in subsequent days when interest rates sharply increased. The 51 bps move of the 10yr rate from April 7th to 11th represents a 3.5 standard deviation move according to ex-ante risk forecast of the MAC3 Weekly model.
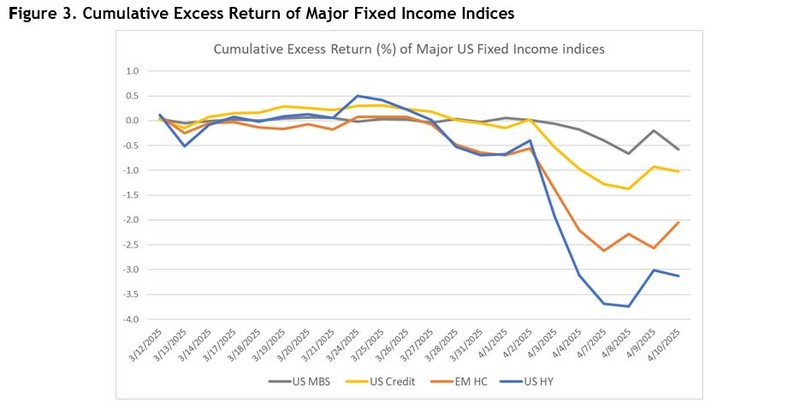
Using the key-rate duration profile of each fixed-income index, we can isolate the impact of interest rate moves (“curve return”) and estimate the excess of interest rates return (“excess return”) as the difference between the total return and curve return. Both the US High Yield Index and the Emerging Markets USD Index showed relatively large negative excess returns in conjunction with the stock market meltdown on April 3rd and 4th, outweighing the positive curve return (Figure 3).
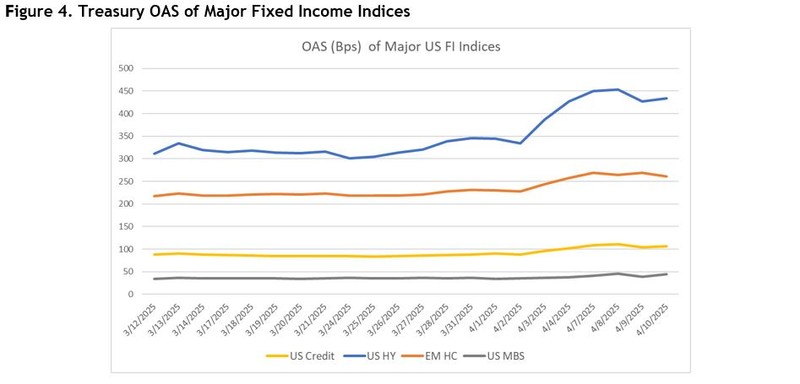
The treasury spread of the US High Yield Index widened by 120 basis points between April 2 and April 8 (a 6.4 standard deviation event based on ex-ante risk forecast from MAC3 weekly model). Correspondingly, the spread of the Emerging Markets USD Index widened by 40 basis points (6 standard deviations) while the spread of the US Investment Grade Credit Index widened by 20 basis points (4 standard deviations), as shown in Figure 4. The spread of the US MBS Index was not notably affected.
Correlation of major MAC3 GRM factors
In the past, during risk-off events, correlations between risky assets increase significantly, whereas correlations between risky and safe-haven assets became strongly negative. This is also reflected in risk factor correlations, for example, the correlations between the equity market factor and credit spread factors moved sharply higher, while the correlations of these factors with respect to the Interest Rate factors became significantly more negative.
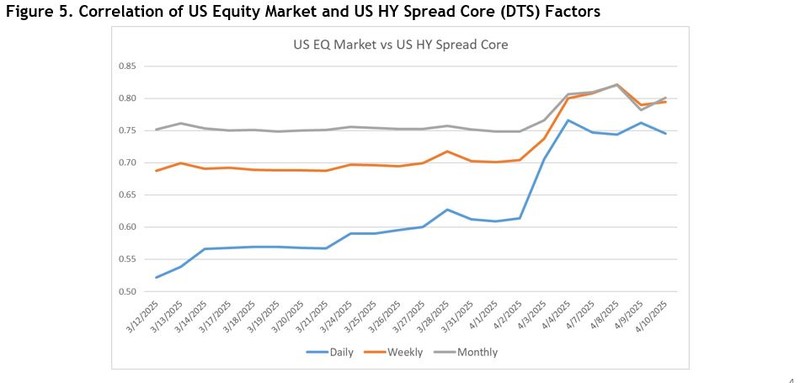
In Figure 5, we present the evolution of the correlation between the US Equity Market factor and the US High Yield Core Spread factor as estimated by the MAC3 risk model for three different horizons: Daily, Weekly and Monthly. It is interesting to observe that the correlation predicted by the daily model started from a much lower level relative to the other two models, about 0.5 for Daily versus 0.75 for Monthly, but climbed to 0.6 by March end. In the first week of April, all three models responded in sync, raising their correlation estimates to about 0.8, a level consistent with previous risk-off episodes. Note that all three models responded simultaneously albeit with different amplitudes (unlike traditional risk models using simple look-back windows), a result of the advanced algorithms of the MAC3 model.
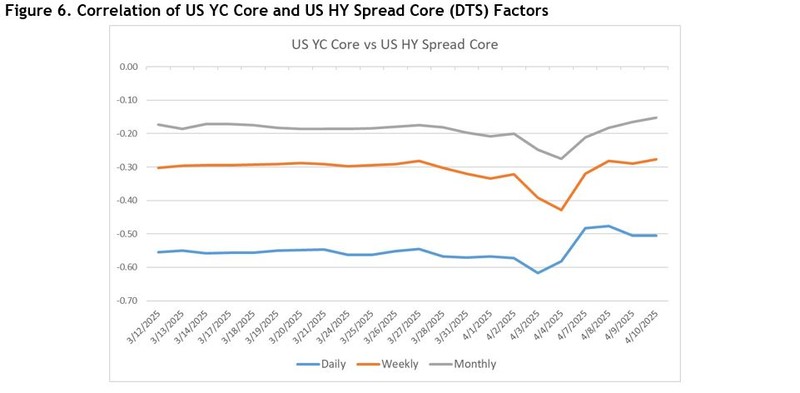
In Figure 6 we present the correlation between the US High Yield Core Spread factor and the US Yield Curve Core factor for the same three model horizons. It is interesting to observe that after the initial flight-to-quality associated with more negative correlations, all three models quickly reverted, with correlation estimates becoming less negative than their pre-crisis levels, indicating concerns about US Bonds.
Risk forecast of major indices
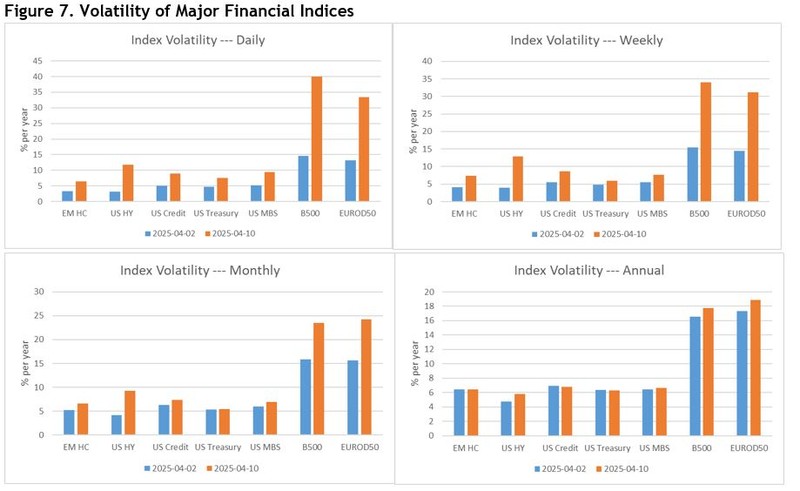
The MAC3 model offers risk estimates at six horizons: Daily, Weekly, Monthly, Quarterly, Annual and Long-term. Figure 7 illustrates the changes in risk estimates for major indices across different horizons. The Daily model predicts higher risk across all indices, with the estimate for equity indices more than doubling between April 2 and April 10. In contrast, the risk increases predicted by the Annual model are more muted.
Factor-based scenario with macroeconomic views
In periods of market uncertainty, macroeconomic scenario analysis is a useful risk management tool to analyze portfolio performance under conditions that represent a departure from the current economic environment that drives estimates of risk models. These macroeconomic scenarios are translated into MAC3 core factor scenarios, which are then used to estimate portfolio performance using the factor-based scenario engine is a feature that will be incorporated into the MAC3 risk model. The translation will utilize the Bloomberg Macro Economic Model (SHOK), a semi-structural general equilibrium model. The SHOK model identifies nine macroeconomic drivers that explain GDP and inflation changes and determine the evolution of PORT market factors.
In the following, we apply this methodology to create a scenario that represents the impact of financial uncertainty on portfolio returns. The SHOK model identifies uncertainty as a fundamental macro-economic factor. We calibrated the shock to the uncertainty factor to cause a drop of 1% to one-year GDP growth expectations.
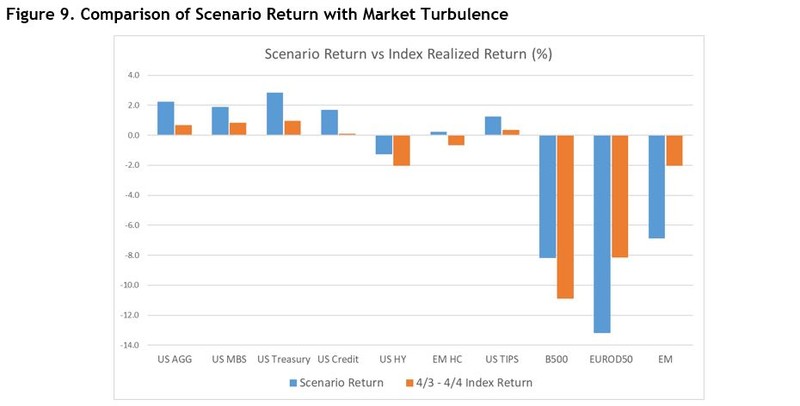
Under such a scenario that corresponds to an increase in VIX of about 40%, the SHOK model predicts a 9.8% increase in oil price, a 9.0% drop in US Equities, a 12.2% drop in Euro Equities, a 17.2% increase in high-yield spreads, and a 46 bps drop in US interest rates. Using these values as inputs, we construct a MAC3 factor-based scenario (Figure 8) and apply it to estimate the return of major indices as of April 2, 2025.
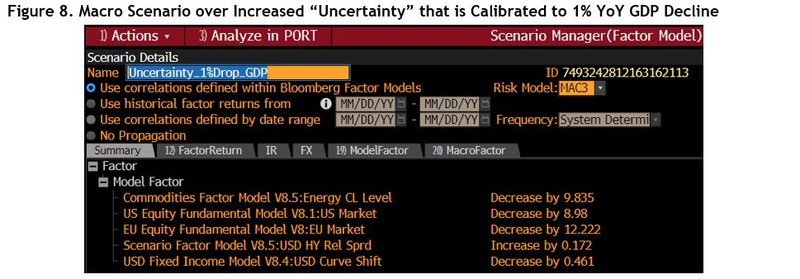
Figure 9 illustrates the scenario returns of ten major indices and compares them with the cumulative realized returns over two days, April 3rd and April 4th. The scenario returns are in line with the actual returns of the major indices, indicating that the 1% GDP decline was consistent with the initial market reaction.
MAC3 QA process during market turbulence
Over recent weeks, our MAC3 model validation system (MVAL) responded promptly to the large market moves, throwing several exceptions to be investigated. When HY spreads jumped more than 50 bps on April 3rd, the volatility of several USD HY spread factors across different industries sharply increased. As the turmoil spread to other global markets, MVAL reported large factor moves (over 5 standard deviations) across more models, including AUD Credit, JPY Credit, EUR Credit, etc. Afterward, as US long-term rates increased and the spread between the 10-year and 2-year reached its highest level since March 2022, MVAL indicated threshold breaches for yield curve level and slope factors for several major currencies. Upon each MVAL breach, model inputs and outputs are reviewed and validated against actual market movements. Meanwhile, large factor outliers are handled using the MAC3 winsorization methodology, enhancing model robustness against such perturbations and ensuring the highest quality risk estimates that market participants require during periods of market turmoil.
The information included in this White Paper is for informational purposes only. Bloomberg Finance L.P. and/or its affiliates (as applicable, “Bloomberg”) makes no guarantee as to the adequacy, correctness or completeness of, or make any representation or warranty (whether express or implied) with respect to this White Paper. To the maximum extent permitted by law, Bloomberg and its affiliates shall not be responsible for or have any liability for any injuries or damages arising out of or in connection with this White Paper. All the information provided in this White Paper is confidential and proprietary to Bloomberg. Customer may not share, reproduce, publish, distribute or communicate this White Paper or information of any kind relating to these responses to any company, third parties or persons other than within Customer and only to such persons on a need-to-know basis in connection with this review.
The BLOOMBERG TERMINAL and other products and services offered by Bloomberg (collectively, the “Services”) are owned and distributed by Bloomberg Finance L.P. except that Bloomberg L.P. (“BLP”) and its subsidiaries distribute the Services in Argentina, Bermuda, China, India, Japan and Korea. Bloomberg Finance L.P. is a wholly-owned subsidiary of BLP. BLP provides Bloomberg Finance L.P. with global marketing and operational support and service for the Services. Certain functionalities distributed via the Services are available only to sophisticated institutional investors and only where the necessary legal clearance has been obtained. Bloomberg Finance L.P., BLP and their affiliates do not guarantee the accuracy of prices or information in the Services. Nothing in the Services shall constitute or be construed as an offering of financial instruments by Bloomberg Finance L.P., BLP or their affiliates, or as investment advice or recommendations by Bloomberg Finance L.P., BLP or their affiliates of an investment strategy or whether or not to “buy”, “sell” or “hold” an investment. BLOOMBERG, BLOOMBERG TERMINAL, BLOOMBERG PROFESSIONAL, BLOOMBERG MARKETS, BLOOMBERG NEWS, BLOOMBERG TRADEBOOK, BLOOMBERG BONDTRADER, BLOOMBERG TELEVISION, BLOOMBERG RADIO, BLOOMBERG.COM and BLOOMBERG ANYWHERE are trademarks and service marks of Bloomberg Finance L.P. or its subsidiaries. All rights reserved.