Manipulating and Visualizing Data Using Pandas & Plotly
In this session we will use Pandas to manipulate and pivot our BQL data, then Plotly to create our heatmap.
You’ll learn:

You’ll learn:
- Clean and structure data with Pandas
- Use Plotly to create a heatmap
Speakers

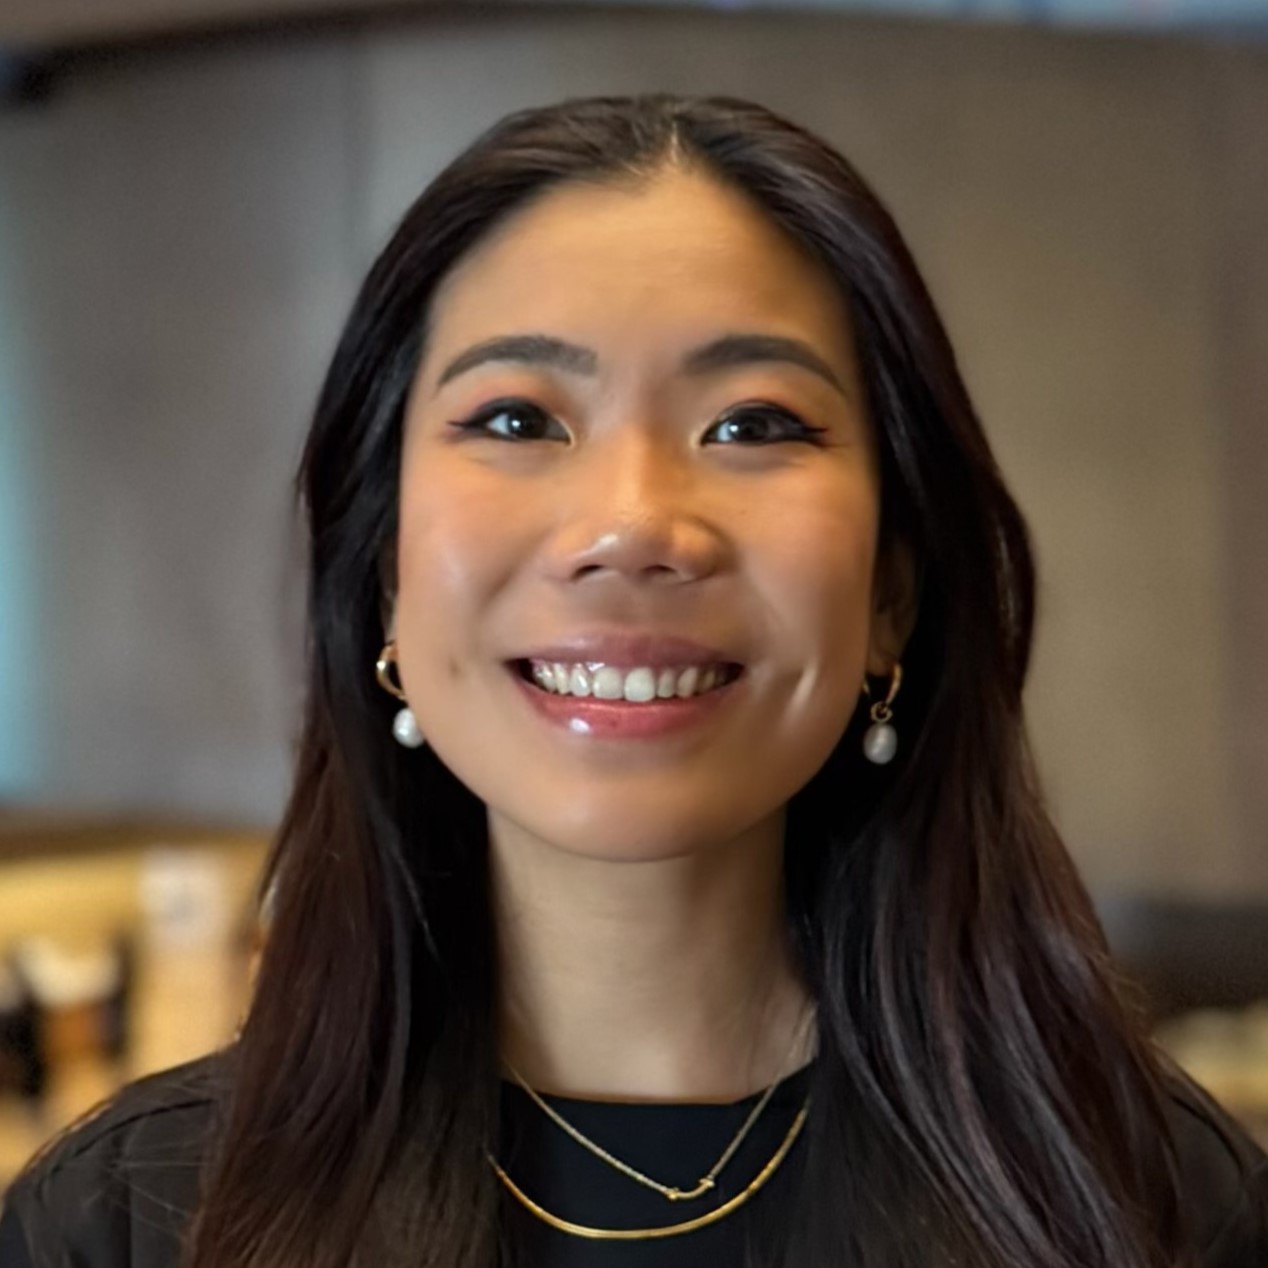
Kathleen Cheng
Quantitative Solutions Developer
Bloomberg
Kathleen is a Solutions Developer at Bloomberg, where she helps clients leverage Bloomberg’s APIs for quantitative solutions and programmatic data analysis. Prior to joining Bloomberg, Kathleen gained experience in business development at Amazon, IT consulting at Accenture, and product development at ByteDance. She holds a Masters of Science in Information Systems from the London School of Economics, and a Bachelors degree from the Technical University of Munich. She has published academic papers on platform ecosystems and has spoken at tech conferences on the subject.