
Bloomberg Professional Services
This article was written by the Bloomberg Enterprise Investment Research Data team: Michael Ashikhmin, Michael Beal, Frances Shi and Lewang Lei.
Welcome to Data Spotlight, our series showcasing insights derived from Bloomberg’s 8,000+ enterprise datasets available on data.bloomberg.com via Data License.
In this edition, we look at how supply chain and facilities data can be used to evaluate tariff-related market shifts in North America. Additionally, we explore how guidance surprises impact stock performance, and how investors can use near real-time transaction data analytics to anticipate revenue surprises.
Looking for our other data-related findings? Explore these recent articles from the Data Spotlight series:
- Navigating tariffs
- Impact of lower AI costs & more
- Broader industry analysis & more
- Supply chain data & AI-based news insights
For more articles in this series click here.
1. Tariffs: Using supply chain and facilities data to evaluate market shifts in North America
In an earlier study, we looked at the two weeks following the 2024 U.S. election and found that companies with U.S.-centric supply chains outperformed their globally exposed peers. That analysis highlighted how supply chain data can reveal investor sentiment during periods of policy change.
In this expanded study, we extend the analysis through July 2025 and across North America markets to capture the effects of the tariff war. Using Bloomberg’s Supply Chain and Facilities datasets, we grouped companies of North America based on presence of US operational exposure or not and examined how performance diverged since the US elections and around key trade announcements.
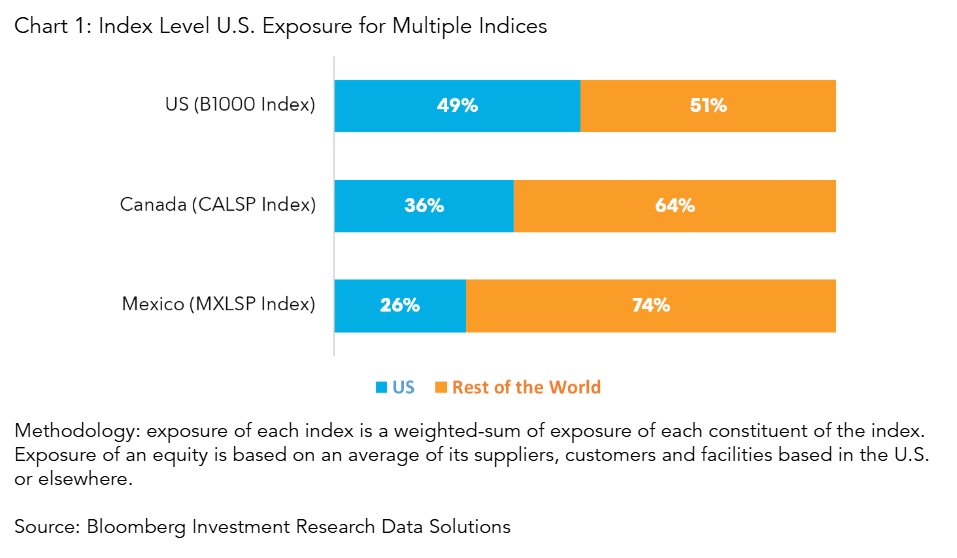
Chart 1 shows the overall average US operational exposure for a selection of Bloomberg Indices for North America. Outside the US, Canada and Mexico are quite exposed countries to the U.S. making them sensitive to any change of trade policy.
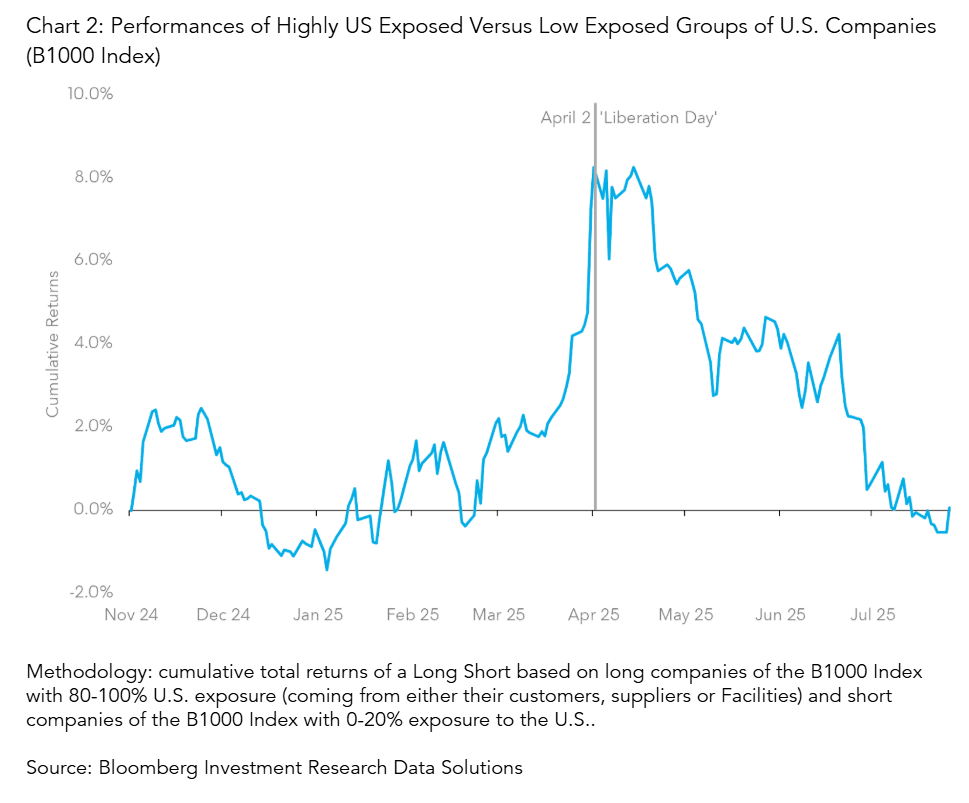
Focusing first on U.S. domiciled companies, Chart 2 shows relative performance of companies with high exposure to the U.S. versus those with low US exposure for companies of the Bloomberg US 1000 Index (B1000) comprised of the largest 1,000 market capitalization in the US. Interestingly, companies with very high U.S. exposure have been performing well from the US Election to April 2025 as the Policy of the Administration has supported US based industries. However after April 2, Liberation Day tariffs, we note a peak and a reversal of this movement – probably highlighting the administration willing to make deals that can be profitable to US companies with global footprint.
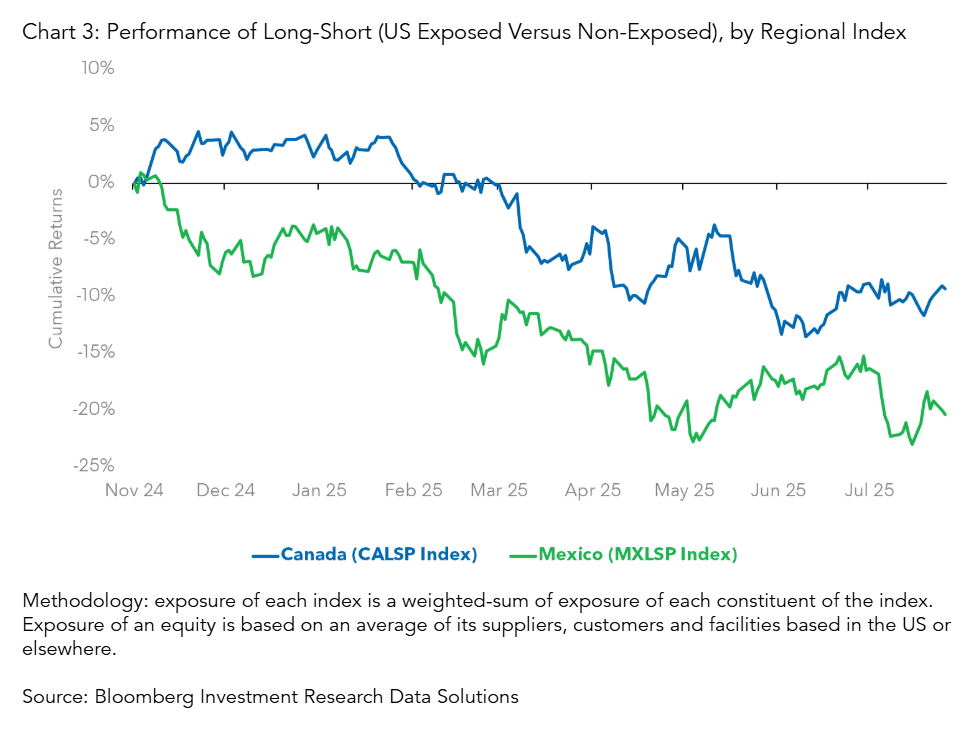
In addition to U.S. companies, we have examined the rest of North America’s largest markets (Canada and Mexico). Chart 3 summarizes the cumulative performance of companies exposed to the US against those without US exposure: it appears that U.S. trade war is translating into negative equity returns for companies in their neighbor doing business with them.
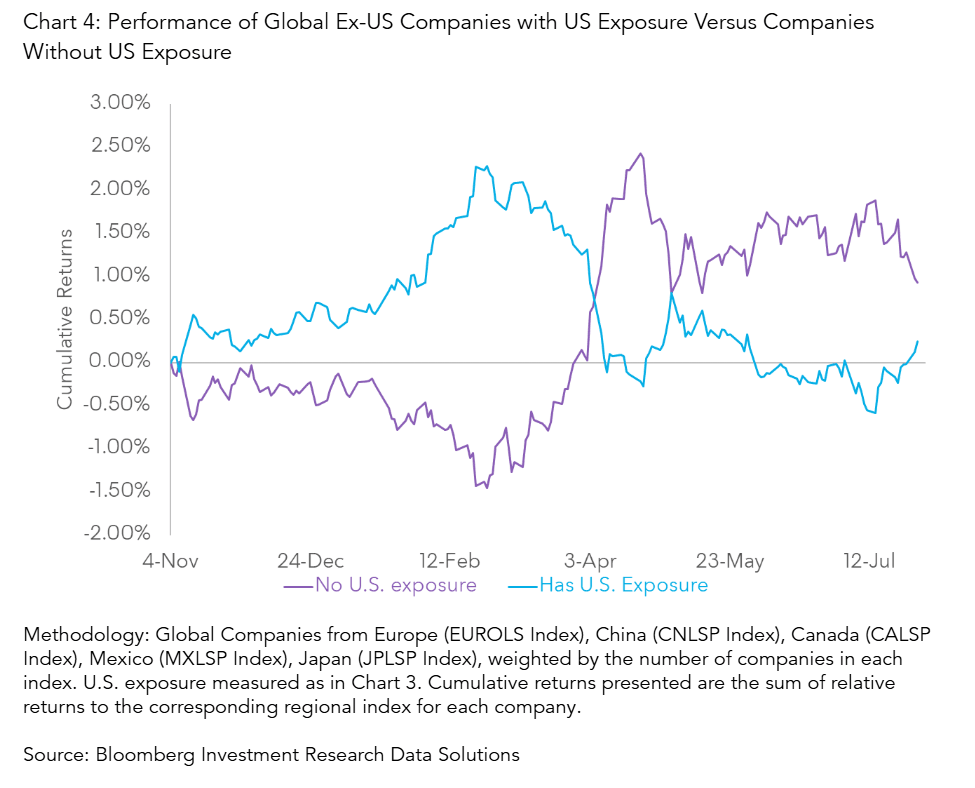
Looking beyond North America, we observe a consistent trend globally (Chart 4).
Themes: Macro Investing, Tariff
Roles: Equity Portfolio Managers, Quants, Strategists
Bloomberg Datasets: Supply Chain, Facilities
2. Tracking when guidance moves markets: the Japanese case
During each earnings season, companies release actual financial results and often provide forward-looking guidance for upcoming quarters or the full fiscal year. While markets – and especially systematic players – have traditionally focused on the difference between reported earnings and consensus expectations because of a lack of availability of company guidance in a machine readable format, our research underscores the increasing importance of monitoring guidance surprises — instances where a company’s outlook materially deviates from market forecasts.
To explore this further, we use Bloomberg’s Company Financials, Estimates and Pricing Point-in-Time dataset to examine the frequency of earnings guidance issuance across various regional indices (Chart 1). The findings reveal that companies in Japan are significantly more likely to provide forward EPS guidance compared to their counterparts in the U.S., China, and Europe — highlighting a notable regional difference in corporate disclosure practices.
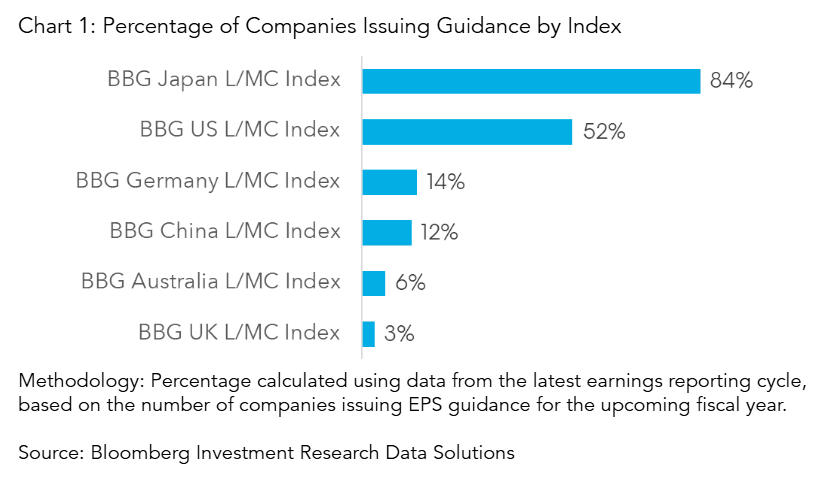
We further used the data from the Japanese equity market to examine how equity markets respond to earnings guidance surprises — defined as the difference between a company’s issued EPS guidance and the consensus EPS estimate for the next fiscal year.
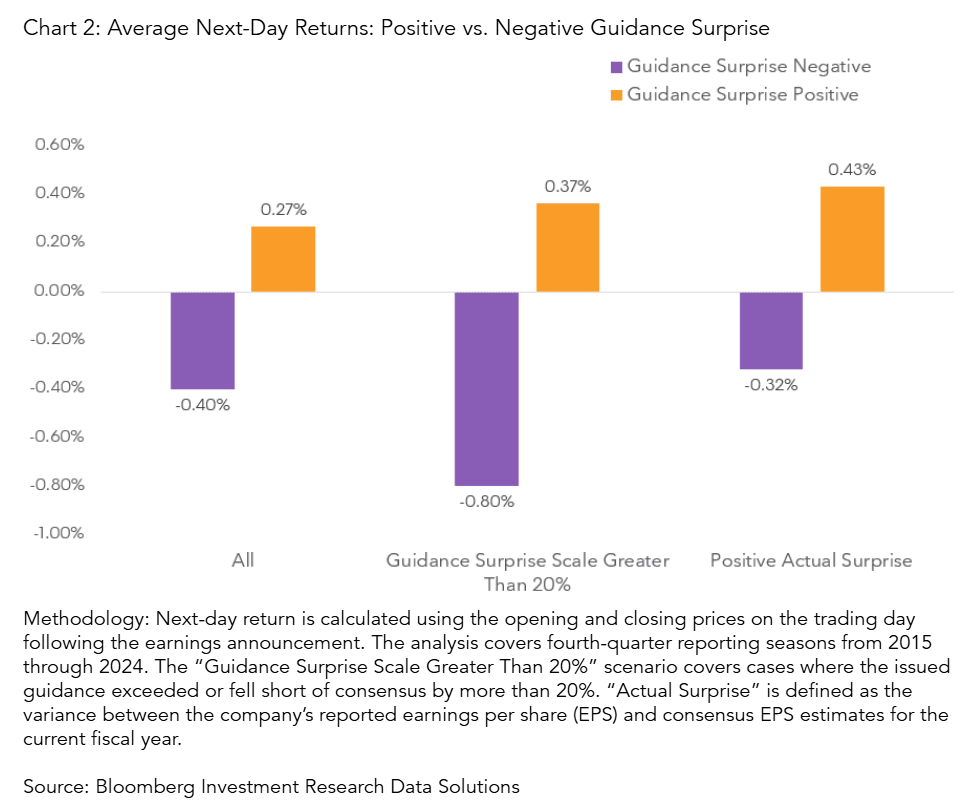
Our findings (Chart 2) show that positive guidance surprises tend to yield immediate next-day positive performance, with the magnitude of the surprise closely correlated to the size of the price move. In contrast, negative guidance surprises tend to trigger immediate declines in stock price — even when reported results exceed expectations.
This shows that investor sentiment can be more sensitive to forward-looking outlook than to trailing performance, with guidance acting as a forward-looking shock that reshapes market expectations and valuations.
Bloomberg Company Financials, Estimates and Pricing Point-in-Time product provides a comprehensive, point-in-time history of company-reported metrics, consensus estimates, and management guidance as well as pricing information. This data enables investors to backtest stock performance accurately around earnings releases, helping investors understand how actuals, consensus estimates, and company-issued guidance interact to drive market reactions.
Themes: Quantitative Trading, Alpha Generation
Roles: Equity Portfolio Managers, Quantitative Researchers, Traders
Bloomberg Datasets: Company Financials, Estimates and Pricing Point-in-Time
3. Analyzing transaction data analytics and estimates to anticipate earnings surprises
Analysts estimates set investor expectations for a company’s performance each period, and earnings surprises often trigger significant stock price movements. If company performance trends can be evaluated ahead of earnings release, it may create opportunities to identify and respond to surprise-driven price actions. Using Bloomberg Second Measure’s near real-time transaction data (available on a 3-day lag via feeds), investors can gain early insights into company performance well before official reports. When combined with consensus estimates from Company Financials, Estimates and Pricing Point-in-Time dataset, it empowers investors to build actionable trading strategies.
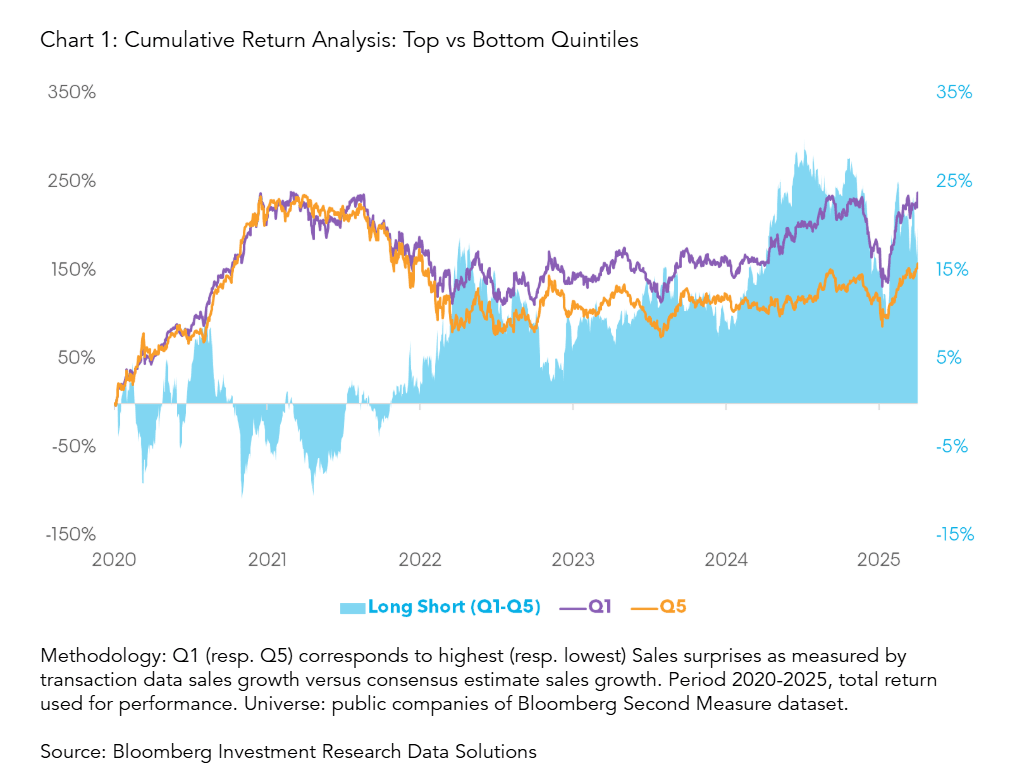
In our study, looking at a quarterly rebalanced backtest from Q2 2020 to Q1 2025 we see that companies in the top quintile of revenue surprises—where transaction data analytics from Bloomberg Second Measure show stronger sales than market expectations—generated higher cumulative returns than those in the bottom quintile.
The Quintile 1 basket delivered robust long-term performance, while the Quintile 5 basket (representing the most negative surprises) showed lower performance. A long–short strategy that takes a long position in Quintile 1 and shorts Quintile 5 produced modest but consistent gains, reinforcing the idea that upside surprises offer a stronger signal than downside disappointments.
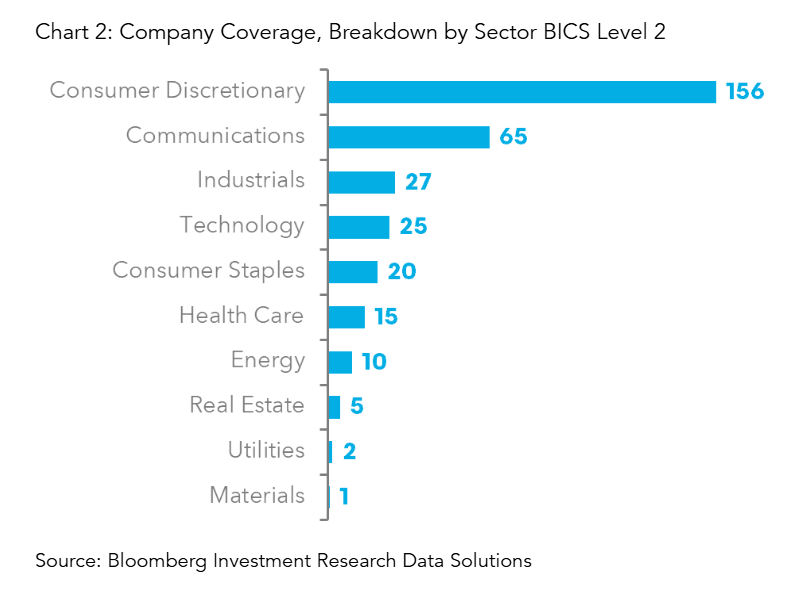
As shown in Chart 2, there are a variety of sectors covered in this analysis. This type of analysis can be refined based on a dedicated sector analysis: indeed this type of strategy may perform differently according to the industry.
These results underscore the value of alternative data might have in anticipating market-moving fundamentals before official disclosures.
Themes: Equity Fundamentals, Alpha Generation
Roles: Equity Portfolio Managers, Quantitative Researchers, Traders
Bloomberg Datasets: Company Financials, Estimates and Pricing Point-in-Time, Bloomberg Second Measure
How can we help?
Bloomberg’s Enterprise Investment Research Data product suite provides end-to-end solutions to power research workflows. Solutions include Company Financials, Estimates, Pricing and Point in Time Data, Operating Segment Fundamentals Data and Industry Specific Company KPIs and Estimates Data products, covering a broad universe of companies and providing deep actionable insights. This product suite also includes Quant Pricing with cross-asset Tick History and Bars. Additional solutions such as Geographic Segment Fundamentals Data, Company Segments and Deep Estimates Data and Pharma Products & Brands Data products will be available in 2025. All of these data solutions are interoperable and can be seamlessly connected with other datasets, including alternative data, and are available through a number of delivery mechanisms, including in the Cloud and via API. More information on these solutions can be found here.
Bloomberg Data License provides billions of data points daily spanning Reference, ESG, Pricing, Risk, Regulation, Fundamentals, Estimates, Historical data and more to help you streamline operations and discover new investment opportunities. Data License content aligns with the data on the Bloomberg Terminal to support investment workflows consistently and at scale across your enterprise.
The data included in these materials are for illustrative purposes only. The BLOOMBERG TERMINAL service and Bloomberg data products (the “Services”) are owned and distributed by Bloomberg Finance L.P. (“BFLP”) except (i) in Argentina, Australia and certain jurisdictions in the Pacific Islands, Bermuda, China, India, Japan, Korea and New Zealand, where Bloomberg L.P. and its subsidiaries (“BLP”) distribute these products, and (ii) in Singapore and the jurisdictions serviced by Bloomberg’s Singapore office, where a subsidiary of BFLP distributes these products. BLP provides BFLP and its subsidiaries with global marketing and operational support and service. Certain features, functions, products and services are available only to sophisticated investors and only where permitted. BFLP, BLP and their affiliates do not guarantee the accuracy of prices or other information in the Services. Nothing in the Services shall constitute or be construed as an offering of financial instruments by BFLP, BLP or their affiliates, or as investment advice or recommendations by BFLP, BLP or their affiliates of an investment strategy or whether or not to “buy”, “sell” or “hold” an investment. Information available via the Services should not be considered as information sufficient upon which to base an investment decision. The following are trademarks and service marks of BFLP, a Delaware limited partnership, or its subsidiaries: BLOOMBERG, BLOOMBERG ANYWHERE, BLOOMBERG MARKETS, BLOOMBERG NEWS, BLOOMBERG PROFESSIONAL, BLOOMBERG TERMINAL and BLOOMBERG.COM. Absence of any trademark or service mark from this list does not waive Bloomberg’s intellectual property rights in that name, mark or logo. All rights reserved. © 2025 – Bloomberg.