Bloomberg Professional Services
- Commodities, as represented by the Bloomberg Commodity Index (BCOM), had one of the best first half starts to a year rising 14% so far in 2026. Similar price action occurred like what was seen in 2022 at the start of one of the last major geopolitical conflicts.
- The BCOM Energy sector drove performance while the attribution from other sectors was neutral.
- Several key themes from the 2026 Commodities Outlook at the start of the year including industrial outshining precious, supply disruptions, temperature rising, have already played out with two quarters in the books.
This article was written by Jim Wiederhold, Commodity Indices Product Manager at Bloomberg.
Several key themes from the 2026 Commodities Outlook at the start of the year, including industrial metals outshining precious metals, supply disruptions and rising temperatures, have already played out with two quarters in the books.
Commodities, as represented by Bloomberg Commodity Index (BCOM), started 2026 with one of their strongest first half performances on record as gold and silver broke out to new all-time highs followed by crude oil prices doubling after the start of the US-Iran war.
PRODUCT MENTIONS
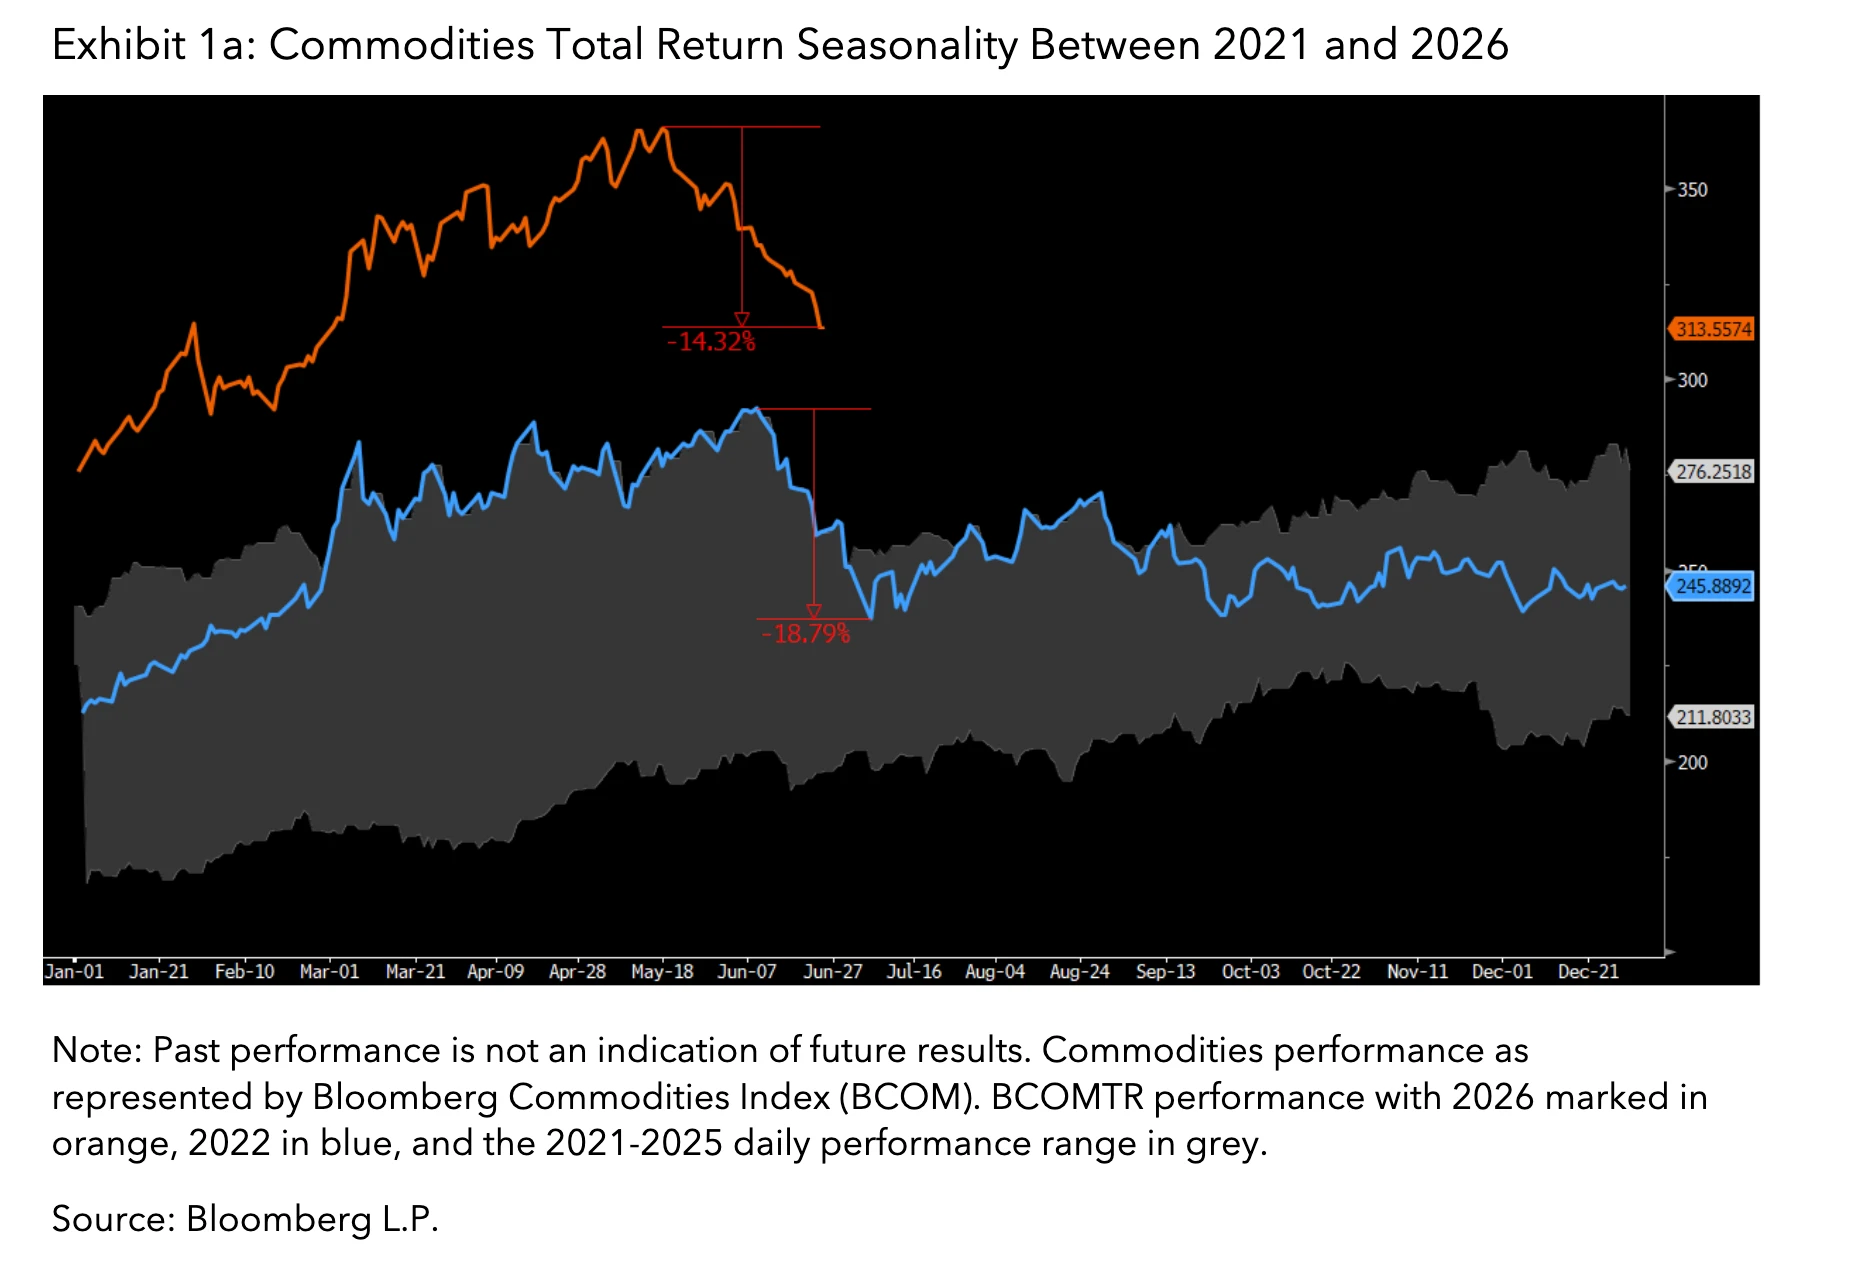
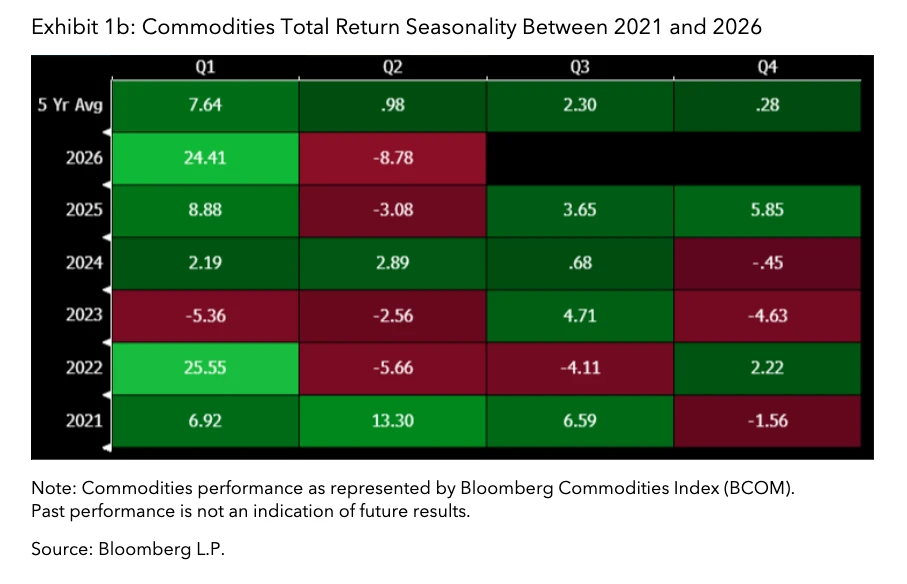
Prices pulled back over the course of the second quarter as precious metals and energy prices consolidated lower in a similar pattern to 2022 as could be seen by the seasonality chart in Exhibits 1a and 1b.
The total return of BCOM (marked in orange) moved higher through the first four months of 2026 and finished June 14% below its May high. This pattern was similar to the move higher, followed by a pullback, in 2022, shown in blue, when the Russia-Ukraine war began. Another look at the performance seasonality with a quarterly heat map shows similar first quarter rises for BCOM by about 25% with smaller pullbacks in the second quarters of each year.
Energy leads H1 2026 commodity performance
The main driver of BCOM’s 14% growth in the first half of 2026 performance was the Energy sector. BCOM Energy rose 38.7% while the BCOM sectors of grains, industrial metals, and livestock each rose by single-digit percentages. The remaining two BCOM sectors, precious metals and , each fell by single-digit percentages year to date.
Oil and petroleum products drove most of the positive performance. These commodities have historically tended to move first when geopolitical conflict arises. A historic supply shutoff this year caused one of the largest oil shocks on record and prices reacted accordingly. The second theme of our 2026 Commodities Outlook highlighted how geopolitical conflicts can interrupt flows, a dynamic that has occurred more regularly across the oil complex in recent years.
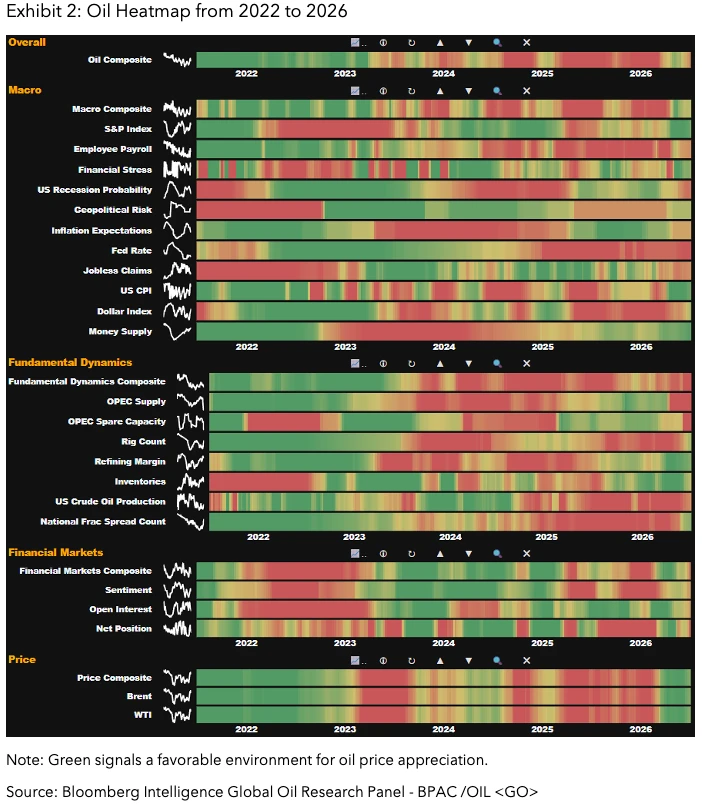
While we had the theme correct for this year, we could not have predicted the magnitude of the impact or the prolonged nature of the conflict after months of continued disruption. Bloomberg Intelligence’s Oil Heatmap shows the drivers moving the price of oil over time in Exhibit 2. Overall, there have been headwinds since 2023 leading to the lower oil price by the start of the year but several key factors this year outside of the US-Iran have been contributing to continued potential upside.
Precious metals pull back after record highs
Beyond energy, precious metals had one of their most significant first halves of a year as prices spiked to new all-time highs and then pulled back sharply. Profit-taking from long-term holders of physical gold could may have played a role here. Central banks which had been buying record amounts of gold for their reserves, also pulled back at the start of the year as all-time high prices reduced demand.
Gold, in particular, tends to follow this type of this price action. We have seen the run higher in prices led to a cooling off period. It typically takes months to years of rangebound prices before continuing on multi-decade trends higher in price. A large part of the recent decline in the price of gold came from a much stronger USD which tends to be a headwind for gold price appreciation.
The confirmation and swearing in of a new Federal Reserve Charman has caused traders to pivot on their interest rate expectations due to an earlier perceived dovish future path by the US Fed and now one focused more on price stability. One potential tailwind is the possibility that central banks begin purchasing gold again after the pullback in prices. Exhibit 3 shows the latest survey results from the World Gold Council where expectations for them to increase their gold reserves over the next 12 months are the highest they have been since 2019.

Grains, soybean oil and weather volatility shape returns
Grains prices had a rollercoaster of a ride through the first half of 2026. Corn, wheat, and soybeans initially rose to highs for the year into May before giving back some performance into the end of the quarter. Wheat and soybeans are still positive year to date but corn is now down on the year as the US crop has proven plentiful.
Soybean oil was a standout in the BCOM universe with the BCOMBOTR rising 44% so far in 2026. The US Environmental Protection Agency finalized much stronger Renewable Fuel Standard requirements for 2026-2027 using soybean oil as the primary feedstock. Pricing in stronger demand, market participants went long futures with net long positioning reaching the most long in the history of CFTC management money reporting going back to 2006.
Extreme heat was felt across different parts of the world, especially in June, when Europe experienced record temperatures early in the summer season. Drought concerns have remained top of mind for investors and we received confirmation from the National Oceanic and Atmospheric Administration (NOAA) that El Nino has arrived. Exhibit 4 shows how El Nino’s can affect different parts of the world particularly in grains and soft-commodities growing regions.

Industrial metals gain as precious metals lose momentum
The first theme of our 2026 outlook, industrial metals to outperform precious metals, is working out halfway through the year. BCOM Industrial Metals rose 6.6% through the end of June, while BCOM Precious metals fell 7.6%. This was a reversal of the sector leadership seen prior to 2026 and can occur once trend exhaustion and high precious metals prices lead to few buyers.
Industrial metals, on the other hand, face supply constraints and potential future demand increases from the global energy transition. Market participants are starting to take this more seriously and position for higher industrial metals prices as renewables’ contribution to the energy mix is growing across every region.
Commodity diversification in a volatile macro environment
With the oil shock this year at the start of the US -ran war, China’s oil imports fell sharply as onshore inventory cushioned the impact of disruptions. Another dynamic that helped to restrain oil prices was the pickup in electric vehicle adoption in China, which requires significant amounts of industrial metals. As this trend continues, reliance on petroleum could diminish as electrification strengthens globally and demand for metals replaces fossil fuels.
BCOM continues to show the potential diversification benefit of holding uncorrelated broad commodities exposure in a portfolio during a conducive macroeconomic environment. Scarcity of raw materials, deglobalization, strategic stockpiling and increased instances of supply disruptions are all contributing to the positive performance environment we are seeing for the commodities asset class.
Will this continue through the rest of the 2020s similar to what we have seen in other commodity bull markets like the 1970s and 2000s? Only time will tell.
The data and other information included in this publication is for illustrative purposes only, available “as is”, non-binding and constitutes the provision of factual information, rather than financial product advice. BLOOMBERG and BLOOMBERG INDICES (the “Indices”) are trademarks or service marks of Bloomberg Finance L.P. (“BFLP”). BFLP and its affiliates, including BISL, the administrator of the Indices, or their licensors own all proprietary rights in the Indices. Bloomberg L.P. (“BLP”) or one of its subsidiaries provides BFLP, BISL and its subsidiaries with global marketing and operational support and service. Certain features, functions, products and services are available only to sophisticated investors and only where permitted. Bloomberg (as defined below) does not approve or endorse these materials or guarantee the accuracy or completeness of any information herein, nor does Bloomberg make any warranty, express or implied, as to the results to be obtained therefrom, and, to the maximum extent allowed by law, Bloomberg shall not have any liability or responsibility for injury or damages arising in connection therewith. Nothing in the Services or Indices shall constitute or be construed as an offering of financial instruments by Bloomberg, or as investment advice or investment recommendations (i.e., recommendations as to whether or not to “buy”, “sell”, “hold”, or to enter or not to enter into any other transaction involving any specific interest or interests) by Bloomberg. Information available via the Index should not be considered as information sufficient upon which to base an investment decision. All information provided by the Index or in this publication is impersonal and not tailored to the needs of any person, entity or group of persons. Absence of any trademark or service mark from this list does not waive Bloomberg’s intellectual property rights in that name, mark or logo. For the purposes of this publication, Bloomberg includes BLP, BFLP, BISL and/or their affiliates.
BISL is registered in England and Wales under registered number 08934023 and has its registered office at 3 Queen Victoria Street, London, England, EC4N 4TQ. BISL is authorised and regulated by the Financial Conduct Authority as a benchmark administrator.
© 2026 Bloomberg. All rights reserved.