
Bloomberg Professional Services
- Fixed income can play different roles within a portfolio depending on its mix of interest-rate and credit risk.
- A fixed income portfolio optimized on its own may look very different once equity exposure is considered.
- A Total Portfolio Approach can help investors assess fixed income based on its contribution to overall portfolio risk and return rather than as a standalone allocation.
This article was written by Vikas Jain, Index Quant Research and Yingjin Gan, Head of Index Research at Bloomberg
The traditional 60/40 portfolio construction draws heavily on different roles played by equity and fixed income in a multi-asset portfolio: equities provide growth, while bonds provide income, diversification and lower portfolio volatility. But “fixed income” is not a single economic exposure. A corporate bond, for example, combines interest-rate and credit risk, and those components can play very different roles in a broader portfolio.
PRODUCT MENTIONS
That distinction matters when deciding how much credit and duration to hold. We separate fixed income returns into two broad factors: duration factor representing interest rate exposure, and credit factor, representing credit spread and default risk. The appropriate balance between the two depends not only on their standalone risk and return, but also on how they interact with the rest of the portfolio.
The traditional two-step approach first decides on the optimal equity-fixed income asset mix, then constructs the optimal equity and fixed income portfolios. However, as we show in our analysis below, the standalone optimal fixed income portfolio can differ significantly from the fixed income allocation implied by the top-level asset allocation exercise, creating an inconsistency between asset allocation and portfolio implementation.
This exercise illustrates a central principle of Total Portfolio Approach (TPA) to evaluate investment decisions based on their contribution to the overall portfolio rather than within individual asset-class silos.
Constructing an optimal fixed income portfolio
A diversified fixed income portfolio can be constructed in many ways. In this exercise, we use the classical mean–variance optimization framework using the duration and spread factors. The maximum-Sharpe portfolio is close to 40% duration and 60% credit spread. The duration factor is represented by the return of 10-year US Treasuries over Treasury bills, while the credit factor is represented by the excess return of US corporate bonds over key-rate-duration-matched Treasuries.
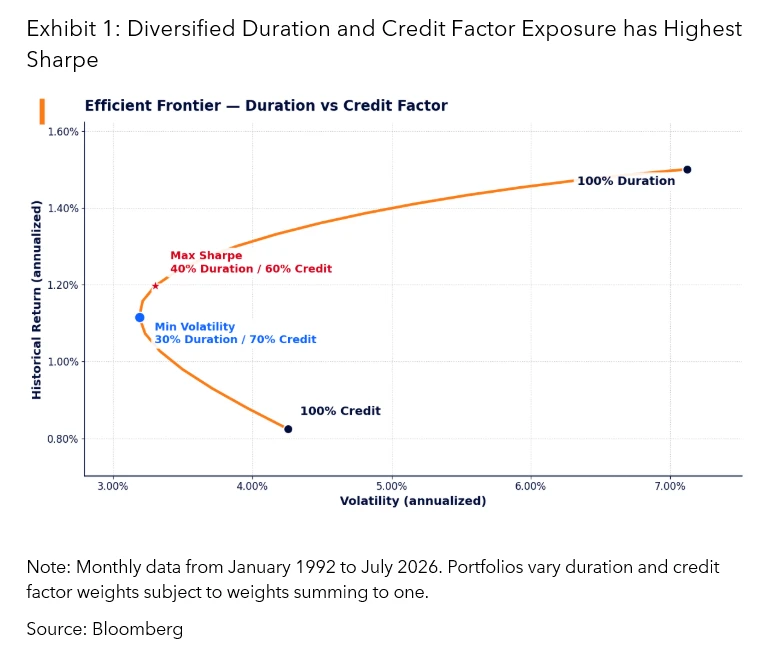
Credit adds carry and combining it with duration factor historically improved the risk-return trade-off versus holding either factor alone. Consistent with this, our recent study found that active managers persistently hold more credit exposure than their stated benchmarks, with much of their apparent outperformance explained by this systematic tilt.
The Bloomberg U.S. Aggregate Index has estimated factor exposures of 0.56 to the duration and 0.34 to the spread factor, while the fixed income-only optimum carries materially more spread exposure. But that changes once equities are added to the portfolio.
Constructing an optimal multi-asset portfolio
The optimal portfolio changes when that bond sleeve is placed alongside equities. In a 60/40 portfolio, the historical minimum-volatility and maximum-Sharpe solutions both moved to 100% duration factor within fixed income, which is materially different from the 30/70 and 40/60 mix of duration and credit presented in previous section.
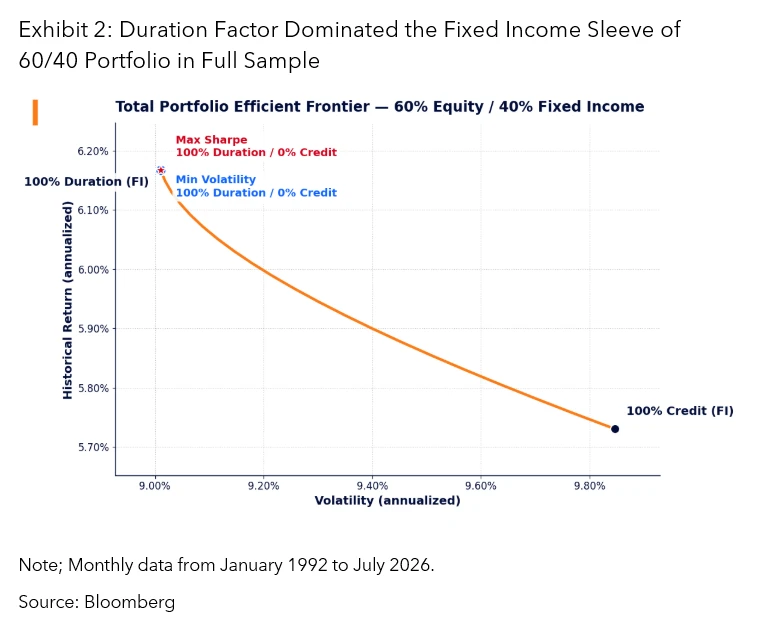
Over the full sample period, credit spreads and equity are both exposed to growth, corporate cash flows and risk appetite. Therefore, they are positively correlated. Duration factor returns, on the other hand, can behave differently when weaker growth brings lower interest rates.
Once equities account for a large share of portfolio risk, another unit of spread exposure may add less diversification than another unit of duration factor exposure.
The result is not unique to a 60/40 equity/fixed income portfolio. As the equity allocation increases, the optimal fixed income sleeve progressively rotates from credit toward duration.
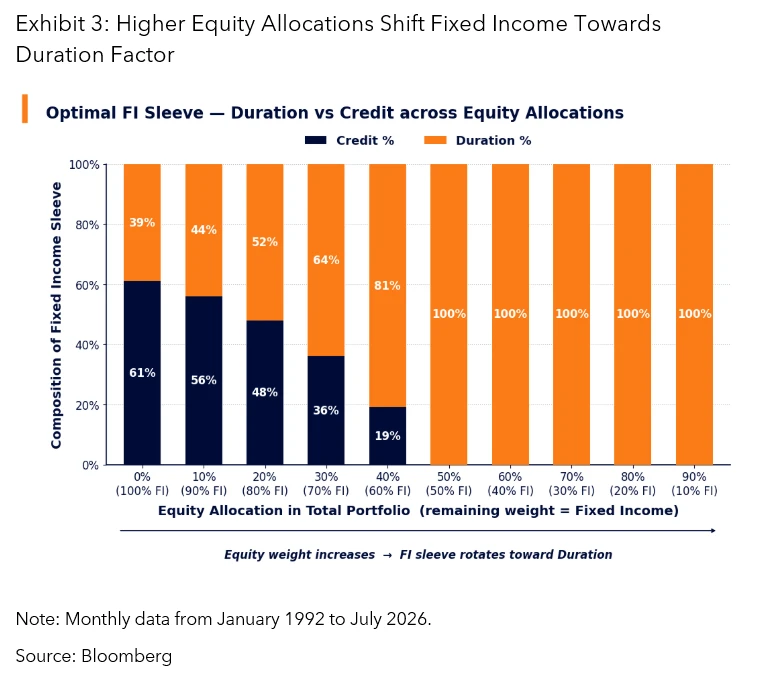
At low equity weights, fixed income carries more of the portfolio’s return objective, making credit’s spread premium valuable. As equity exposure rises, the portfolio already contains substantial exposure to growth, increasing the relative value of duration factor as a diversifier.
This illustrates why asset allocation and implementation cannot always be considered separately. A top-down equity target combined with a bond portfolio optimized against a separate benchmark can produce a factor mix that does not match the fund’s overall intended risk. Under a total-portfolio framework, the equity allocation and duration-credit mix are often considered together.
This analysis uses mean-variance efficiency as a measure of portfolio success. In practice, however, the optimal portfolio under a TPA can also reflect fund-specific objectives and constraints. Liabilities are an important example: their cashflow and interest-rate characteristics can increase the value of income, liquidity and duration hedging, materially changing the role of fixed income in the portfolio.
How does the optimal mix change across market regimes?
The full-sample results point strongly toward duration factor as equity exposure increases. But this conclusion depends on the relationship between stocks and interest rates, which has changed over time.
Equity-credit correlation has historically remained persistently positive, while the relationship between equities and duration factor has changed sign multiple times over the past few decades.
During growth-led slowdowns, central banks often cut rates, allowing duration factor to gain as equities fall. During inflation shocks, rates can rise as equities decline, weakening or reversing that hedge.
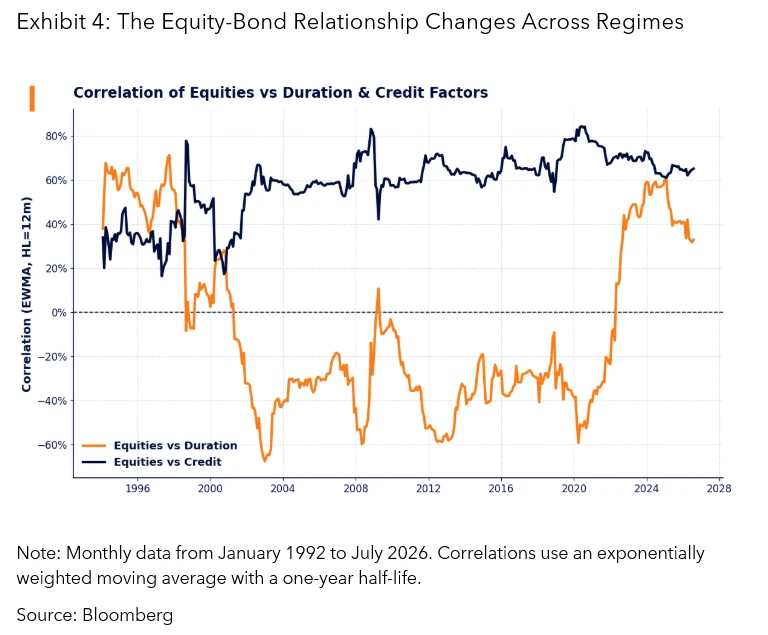
We tested the maximum-Sharpe mix in different periods. Duration factor was the primary driver of the efficient fixed income mix during 2002-2021, when the equity-duration factor correlation was predominantly negative. Credit became more relevant after 2022 as inflation pushed the equity-duration factor relationship back into positive territory.
To stress-test the result, we extended the analysis using estimated factor returns for the 1973-81 stagflation period. In that environment, credit dominated both the fixed income only and total-portfolio efficient frontiers.
As the dominant shock shifts from growth to inflation, the diversification value of duration factor can change. The sub-period analysis show that the appropriate role of fixed income depends both on the rest of the portfolio and on the macroeconomic risks the portfolio faces.
What does a total portfolio approach mean for fixed income?
The 60/40 label says relatively little about the risks beneath the “40”. Fixed income can provide income and return, hedge equity risk, or introduce another source of growth exposure depending on its duration and credit factor mix.
The appropriate mix therefore cannot be determined by optimizing fixed income in isolation. It depends on the composition of the total portfolio and on the macroeconomic risk investors are seeking to manage. A credit-heavy benchmark embeds materially different economic exposures from a Treasury-heavy benchmark. Under a Total Portfolio Approach, choosing the fixed income benchmark is part of the asset-allocation decision, not simply an implementation choice.
Precision and customization in fixed income indexing
Viewing fixed income through a total portfolio lens also puts greater emphasis on selecting benchmark exposures that align with broader portfolio objectives.
As portfolio construction becomes more targeted, defining benchmark exposures with precision is becoming increasingly important. Bloomberg Fixed Income Indices give investors tools to tailor exposures quickly and accurately. Supported by integrated data and analytics on the Bloomberg Terminal, users can combine asset classes, apply constraints and refine methodologies in line with specific investment objectives.