This analysis is by Bloomberg Intelligence Commodity Strategist Mike McGlone and Senior Market Structure Analyst Jamie Douglas Coutts. It appeared first on the Bloomberg Terminal.
The demise of fossil fuels vs. the rise of digital assets may be unstoppable trends. We see Russia’s invasion of Ukraine marking another milestone for the merits of cryptos vs. oil and gas from mercurial sources. Trends gaining endurance are Bitcoin and Ethereum joining portfolios and the proliferation of crypto dollars. Despite the Federal Reserve’s need to reduce the wealth effect, the top two cryptos still outperform most assets, notably on a risk-adjusted basis. The war is enhancing Bitcoin’s value as a global digital-reserve asset, while Ethereum evolves into the collateral of the internet.
Discounted cash flow (DCF) analysis shows Ethereum may be undervalued as it approaches an upgrade. Trend signals are positive for layer 1 chains Solana, Terra and Avalanche, but are subject to a receding tide.
Bitcoin, cryptos are beating an ebbing tide, but risks elevated
Risk assets were ground down some in 1Q, and cryptos are among the most exposed. The war and disruptions in markets like nickel are adding to the narrative that Bitcoin is the most fluid, 24/7 global trading vehicle in history and well on its way to becoming digital collateral.
Cryptos vs. Equities: Outperformance, declining volatility
The potential of the new technology/asset class may be seen in the nearly 800% gain for the Bloomberg Galaxy Crypto Index (BGCI) since the end of 2019 (to April 4) vs. almost 70% for the Nasdaq 100 Stock Index. Outsized performance typically comes with volatility, and our graphic shows the BGCI has twice corrected about 50% from 2021 peaks. What’s notable is the crypto index’s 90-day volatility has declined to about 2x that of the stock gauge. Down about a half as much as the roughly 8% decline in the Nasdaq 100 (despite 2x the risk) indicates divergent strength for the crypto index.
Since the BGCI launched in August 2017, 90-day volatility has averaged about 4.4x that of the Nasdaq 100. Cryptos remain a small portion of portfolio allocations, and we sense responsive buyers on dips vs. equity sellers on rallies.
What stops cryptos outperforming equities?

Inflection? Recovering Bitcoin vs. Weak equities
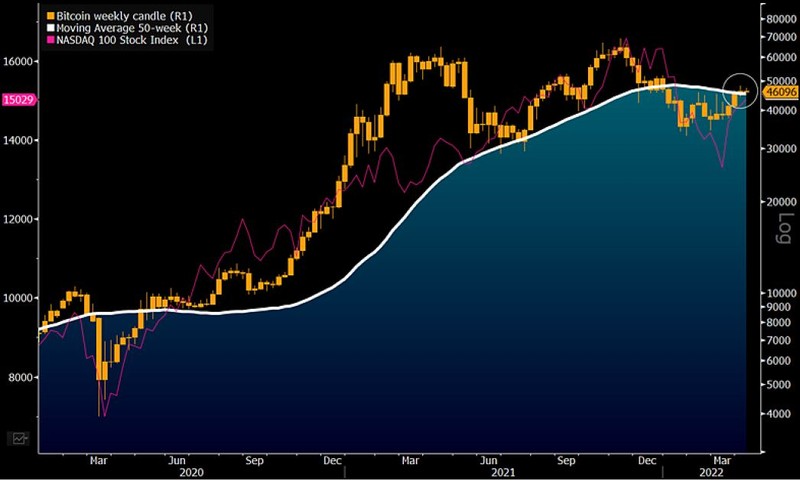
Bitcoin has shown divergent strength in 2022 and may be on its way to breaching key resistance around its 50-week moving average. Sustaining above $46,300 for the year, but with the Nasdaq 100 Stock Index still down about 8%, may mark an inflection for the benchmark crypto. Our chart of Bitcoin shows a market seemingly pulled lower by equities in 2022 but coming out ahead toward the end of 1Q. Forces toward reversion lower may be more prevalent in equities.
Every day that the Federal Reserve wakes up to rising asset prices, our take is it becomes more concerned about related inflation and inclined to do something about it. Bitcoin is poised to come out ahead of what may be an overdue mean reversion for risk assets.
Bitcoin buoyancy may outlast the stock market

Risks tilting toward a more volatile 2022
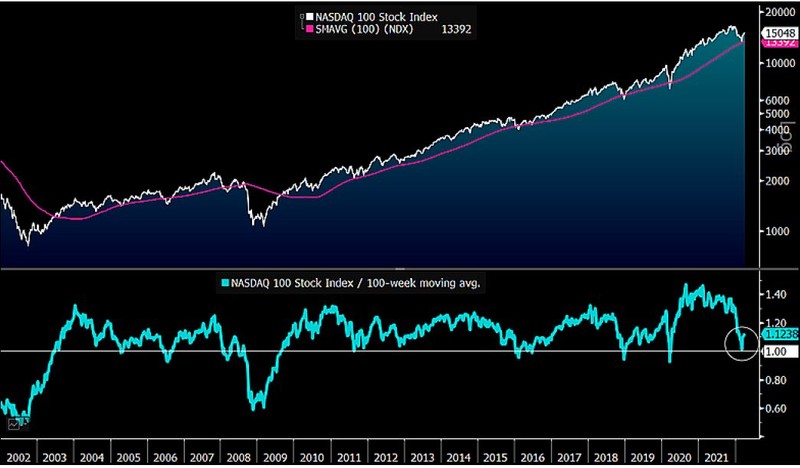
Bitcoin appears poised to outperform the Nasdaq 100 in most scenarios. The 2022 dip may be done, if the history of the stock market since the inception of Bitcoin in 2009 is any indication. As the world acclimates to Covid-19, the Fed tightens and war in Ukraine extends, our take is that it’s unlikely to be that easy. The graphic shows the Nasdaq 100 Stock Index bouncing from revisiting its 100-week moving average for the first time since the 2020 swoon. A shakeout more akin to the financial crisis may be overdue.
Bitcoin typically trades at about 3x the volatility of the Nasdaq, but it’s about unchanged vs. the index’s 8% slide to April 4.
This chart may define 2022: Can it be that easy?

Nickel shows a better Way Akin to Bitcoin
“It shows good chart” is the traders’ mantra that represents how many traditional markets may be falling behind digital assets. Constant price discovery without distortions, limits or central-party control are attributes of blockchain-based assets like Bitcoin, and the money is migrating to where it’s treated best. Our graphic shows the distinct differences in the every day liquidity and price discovery of Bitcoin vs. the LME-traded nickel future, which trades for fewer hours only on business days. Bitcoin’s 60-day average volume from Coinmarketcap is about 4x that of $6 billion for nickel futures.
Old-guard trading distortions in equity futures in 2020 — and more recently nickel — extol the value of nascent crypto technology and assets. Bitcoin is predominant and well on its way to becoming global digital collateral.
Bitcoin: `Good Chart’ and Liquidity vs. Nickel
