ARTICLE
Data Spotlight: Measuring trade war exposure, news sentiment & more

Bloomberg Professional Services
This article was written by the Bloomberg Enterprise Investment Research Data team and CTO team: Ruslan Tepelyan, Maris Serzans and Jerome Barkate.
Welcome to Data Spotlight, our series showcasing insights derived from Bloomberg’s 8,000+ enterprise datasets available on data.bloomberg.com via Data License.
In this edition, we look at how revenue breakdowns and fund holdings data can be combined to help assess exposure to shifting global trade conditions. Additionally, we explore how combining news sentiment with tick data supports dynamic trading strategies, and how investors can use Open-High-Low-Close (OHLC) bar timing data to capture intraday price shifts.
Looking for our other data-related findings? Explore these recent articles from the Data Spotlight series:
- Navigating tariffs
- Impact of lower AI costs & more
- Broader industry analysis & more
- Supply chain data & AI-based news insights
For more articles in this series click here.
1. Measuring funds’ exposure to the trade war
In a period of high geopolitical tensions, understanding how macro themes like trade war impact investment portfolios is critical. One powerful method is to analyze fund exposure by combining industry segment data and fund holdings to get an accurate exposure of a fund to various industries beyond the traditional reporting framework.
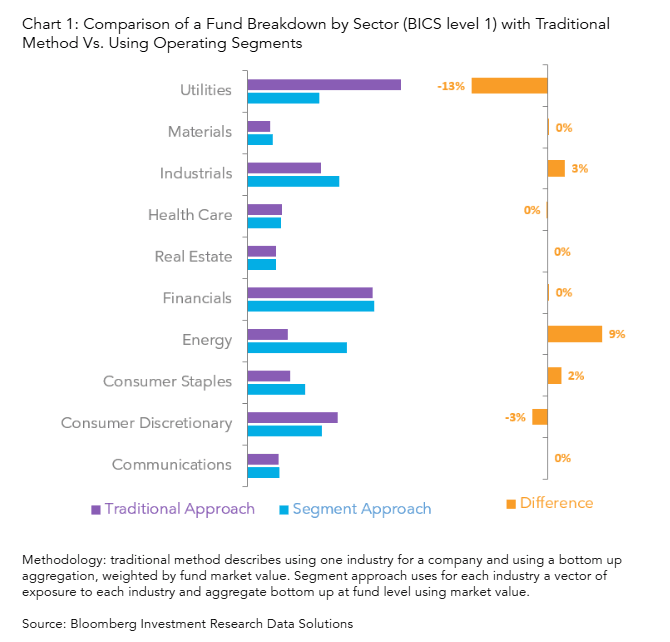
Chart 1 provides a comparison for a fund of an industry breakdown using the traditional method and operating segment data: segment data provides a more granular view of the actual sector exposure of a fund. In this example, without segments (purple in the chart) the fund seems to have high exposure to Utilities versus Energy, whereas using segments (blue), the picture is much more balanced.
The methodology we use begins with assigning tariff sensitivity scores to each industry based on prevailing trade policies. This provides us with a measure of revenue sensitivity for companies in that industry. Then, for each fund, we calculate a weighted-sum of the percentage of revenue derived from these industries. The weights are determined by the fund’s market value allocation to each holding.
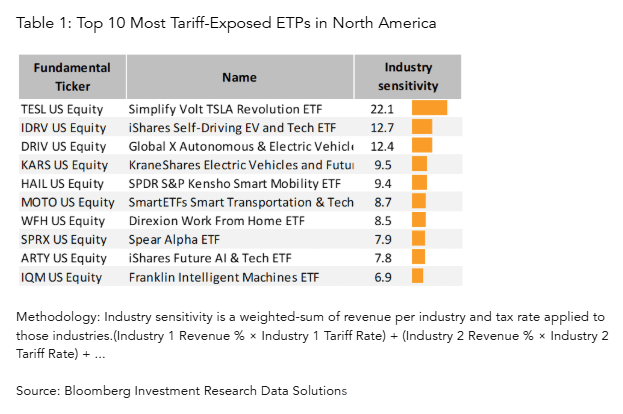
This approach allows us to estimate how much of a fund’s revenue base is exposed to industries most affected by tariffs. The result is a clear, quantifiable measure of trade war sensitivity. As illustrated in Table 1, this analysis highlights which funds are most vulnerable to trade-related disruptions. Investors can use this insight to rebalance portfolios, hedge exposures, or identify opportunities in funds that are relatively insulated.
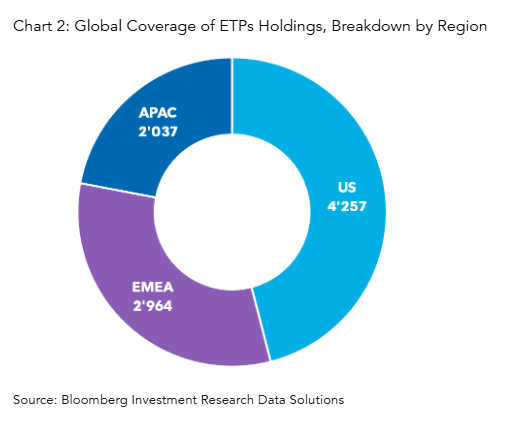
This study is utilizing Exchange Traded Products (ETPs) and using Bloomberg’s extensive coverage, spanning nearly 10,000 ETPs and 55,000 companies categorized by industry segments, we can quantify exposure to trade war risks with a bottom-up methodology. Chart 2 showcases the breadth of ETP coverage that underpins this methodology.
This type of approach helps bring clarity to a complex macroeconomic theme and make more informed investment decisions.
Theme: Macro and Fund Investing
Roles: Portfolio Managers, Fund Analysts, Risk Managers, Strategists
Bloomberg Dataset: Operating Segment Fundamentals, ETP Holdings, Fund Holdings
2. Using OHLC bar timing to spot market opportunities
OHLC bar data is a widely used format for representing prices change over time, offering a practical balance between simplicity and informativeness. It is used by a wide range of market participants including quantitative analysts, portfolio managers, algorithmic traders, and risk managers, who rely on OHLC data to monitor price movements, evaluate historical performance, and refine execution strategies.
Bloomberg recently introduced an enhanced version of this data that includes timestamps for when the open, high, low, and close prices occurred within each bar, as well as over 40 additional fields (including VWAP), with historical data available back to 2008. In this piece, we explore how knowing the exact times when price points occur may be used to inform trading strategies.
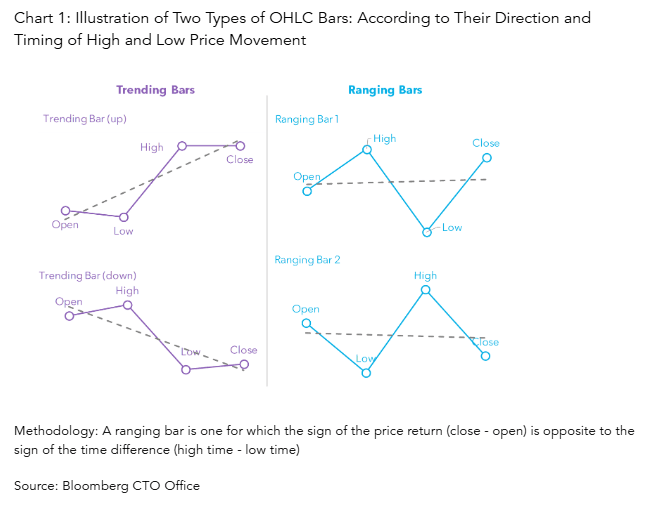
As a first step, we classify each OHLC bar into one of two categories based on the timing of their high and low prices: “trending bars” or “ranging bars”. Chart 1 illustrates the difference. A “trending bar” is one in which the direction of the price move (from open to close) aligns with the ordering of the high and low timestamps: for example, in an upward-moving bar, the low occurs before the high. In contrast, a “ranging bar” exhibits the opposite pattern: the high occurs before the low even though the price increased, or the low comes before the high despite a price decline. In these cases, the Open-to-Close and Low-to-High segments point in opposite directions.
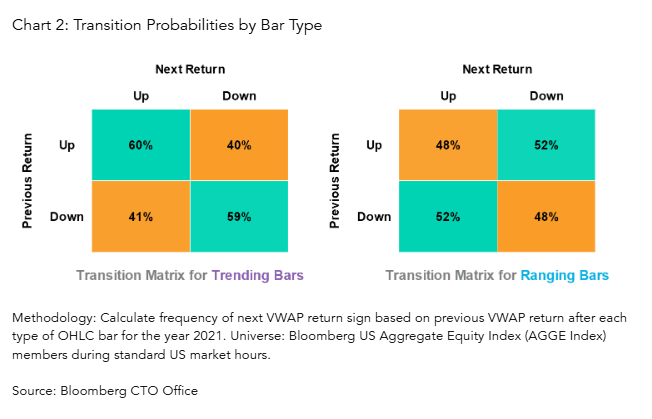
To explore the correlation between bar types and short-term price movements we measure how often the sign of a VWAP return persists across consecutive one-minute bars -separately for trending and ranging bars. In other words, we examine whether an upward (or downward) VWAP move is more or less likely to continue depending on the type of the previous bar.
Chart 2 shows the transition matrices for each case. When the previous bar is a trending bar, the VWAP return is more likely to continue in the same direction: up is followed by up 60% of the time, and down is followed by down 59% of the time. In contrast, ranging bars exhibit the opposite behavior -returns tend to reverse. An up move is followed by a down move 52% of the time, and vice versa.
These patterns suggest that bar type, as defined by high/low timing, offers a simple but effective signal of short-term trend persistence or reversal.
This analysis shows that adding high and low timestamps to OHLC data can uncover meaningful patterns in short-term market behavior. A simple timing-based feature can help statistically distinguish between a trend that is more likely to continue versus one that may reverse. More broadly, simple, interpretable features derived from richer temporal context can enhance models built on conventional price data alone.
Theme: Trading
Roles: Traders, Quants, Portfolio Managers, Researcher
Bloomberg Dataset: OHLC Per Security
3. Building investment strategies with custom news sentiment using NLP
Investors often look at news headlines as a potential driver of asset price movements. However, the sheer volume of news makes human analysis impractical. Instead, an effective approach for programmatically monitoring headlines is to quantify their sentiment and assess how it correlates to asset behavior. In this study, we apply this method to Crude Oil futures (CL1) using our proprietary News Headlines dataset, which includes both Bloomberg and Third-Party news headlines, and allows us to quickly filter headlines based on relevant topic codes.
The methodology in this insight applies natural language processing (NLP) models to generate sentiment scores from headlines. The sentiment values are normalized using z-scores to detect outlier events over a 7-day period, defined as significantly more positive or negative sentiment than historical norms. We use two different models to get a more diversified opinion on the sentiment. (See Chart 1)
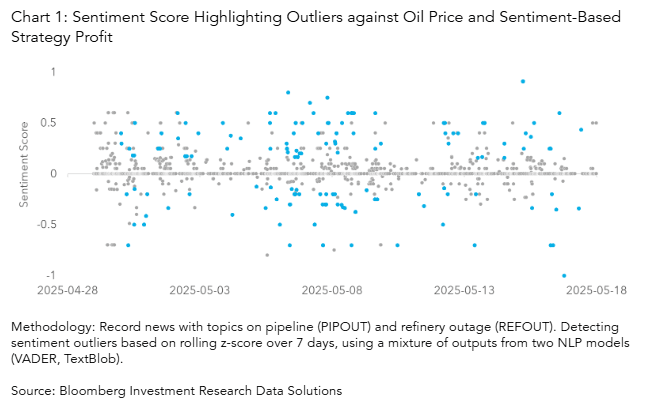
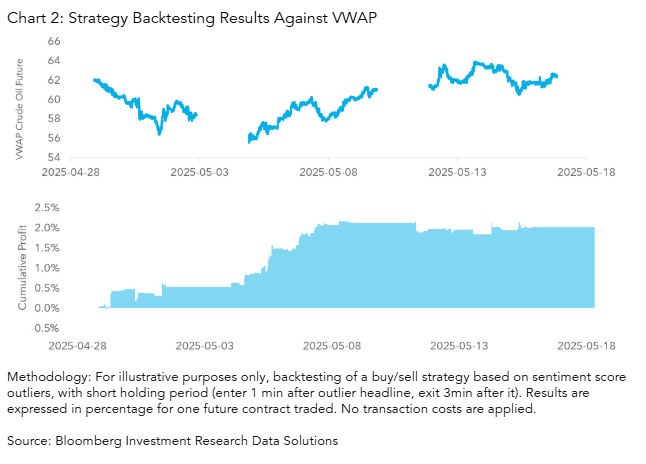
We backtest the performance of trading CL1 contracts following these sentiment outliers by using Tick History data which allows users to directly use the generic ticker CL1 Comdty. Importantly, in the context of crude oil, negative sentiment often signals supply disruptions, such as geopolitical tensions or production outages, which historically lead to price increases. This inverse relationship is a nuance in interpreting sentiment signals for commodities.
Our approach allows us to isolate periods where sentiment diverges sharply from the norm and evaluate the subsequent price action. Chart 2 shows pricing data as well as the results of this type of strategy for illustrative purposes, against Volume-Weighted Average Price (VWAP), a trading benchmark that represents the average price of oil contracts.
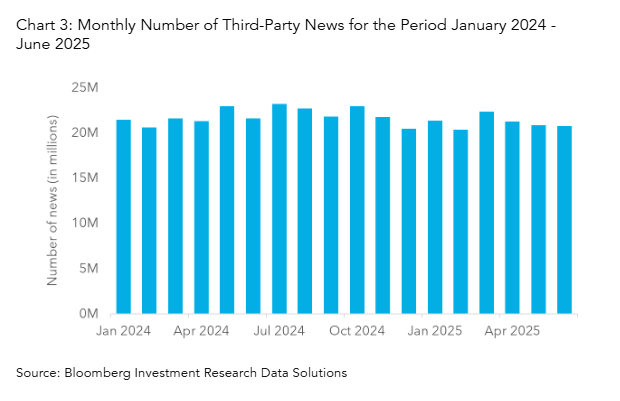
This analysis draws exclusively from Bloomberg’s News Headlines product, which offers extensive coverage – including from third-party sources – as illustrated in Chart 3 and is optimized for integration with NLP pipelines.
Theme: Macro Sentiment
Roles: Traders, Quants, Portfolio Managers, Risk Managers, Strategists
Bloomberg Dataset: News Headlines, Tick History
How can we help?
Bloomberg’s Enterprise Investment Research Data product suite provides end-to-end solutions to power research workflows. Solutions include Company Financials, Estimates, Pricing and Point in Time Data, Operating Segment Fundamentals Data and Industry Specific Company KPIs and Estimates Data products, covering a broad universe of companies and providing deep actionable insights. This product suite also includes Quant Pricing with cross-asset Tick History and Bars. Additional solutions such as Geographic Segment Fundamentals Data, Company Segments and Deep Estimates Data and Pharma Products & Brands Data products will be available in 2025. All of these data solutions are interoperable and can be seamlessly connected with other datasets, including alternative data, and are available through a number of delivery mechanisms, including in the Cloud and via API. More information on these solutions can be found here.
Bloomberg Data License provides billions of data points daily spanning Reference, ESG, Pricing, Risk, Regulation, Fundamentals, Estimates, Historical data and more to help you streamline operations and discover new investment opportunities. Data License content aligns with the data on the Bloomberg Terminal to support investment workflows consistently and at scale across your enterprise.
The data included in these materials are for illustrative purposes only. The BLOOMBERG TERMINAL service and Bloomberg data products (the “Services”) are owned and distributed by Bloomberg Finance L.P. (“BFLP”) except (i) in Argentina, Australia and certain jurisdictions in the Pacific Islands, Bermuda, China, India, Japan, Korea and New Zealand, where Bloomberg L.P. and its subsidiaries (“BLP”) distribute these products, and (ii) in Singapore and the jurisdictions serviced by Bloomberg’s Singapore office, where a subsidiary of BFLP distributes these products. BLP provides BFLP and its subsidiaries with global marketing and operational support and service. Certain features, functions, products and services are available only to sophisticated investors and only where permitted. BFLP, BLP and their affiliates do not guarantee the accuracy of prices or other information in the Services. Nothing in the Services shall constitute or be construed as an offering of financial instruments by BFLP, BLP or their affiliates, or as investment advice or recommendations by BFLP, BLP or their affiliates of an investment strategy or whether or not to “buy”, “sell” or “hold” an investment. Information available via the Services should not be considered as information sufficient upon which to base an investment decision. The following are trademarks and service marks of BFLP, a Delaware limited partnership, or its subsidiaries: BLOOMBERG, BLOOMBERG ANYWHERE, BLOOMBERG MARKETS, BLOOMBERG NEWS, BLOOMBERG PROFESSIONAL, BLOOMBERG TERMINAL and BLOOMBERG.COM. Absence of any trademark or service mark from this list does not waive Bloomberg’s intellectual property rights in that name, mark or logo. All rights reserved. © 2025 – Bloomberg.