Bloomberg Professional Services
This article was written by David Krein, Head of Real-Time Pricing Research and Chirag Gupta, AI Researcher at Bloomberg.
Welcome to Pricing Insights our series exploring key themes in the fixed income market. For more articles in this series, click here.
In our previous article, we looked at evaluating portfolio trading (PT) performance in the US investment grade market. One detail that stood out in that analysis was the steep underperformance of blocks. There, we calculated the median performance for trades >=$5mm that were flagged as PTs on TRACE, the consolidated system for corporate bonds in the US, and observed that they traded 2.68 cents wider than IBVAL, Bloomberg’s intraday pricing solution (see Chart 1).
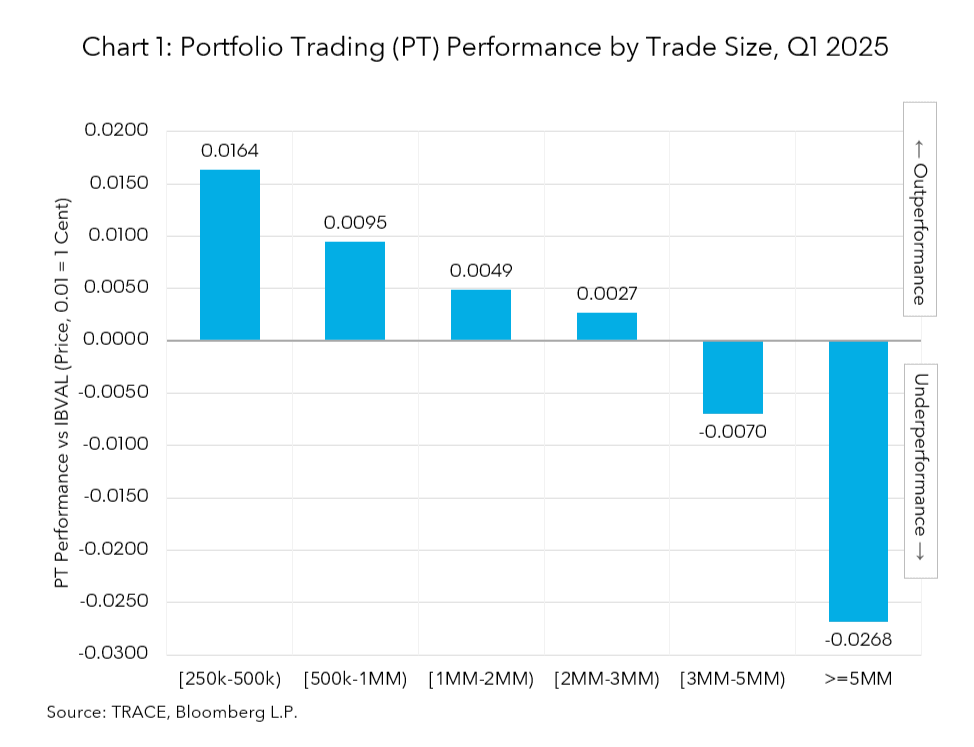
Notably this graph implicitly treats these blocks as unrelated and independent. However, this is not the case. PTs allow for many trades to be bundled together, where block pricing can be influenced by the total number of blocks, number of smaller line items, or even the presence of high-yield bonds.
This analysis intends to illustrate for traders and market participants how PT performance is affected by its total number of investment grade (IG) blocks.
PRODUCT MENTIONS
Methodology
In TRACE, a “PT” is reported as a condition code for line items, but the group information is unavailable. As a first step, we identify the PT group, or the set of individual TRACE trades that were likely part of the same transaction, based on the timestamp information. Then, for each PT, we identify two quantities of interest:
- The number of IG blocks in the PT.
- An aggregate “PT cost” relative to IBVAL. This is the volume-weighted average of the side-aligned difference between IBVAL and the trade level of each line item. That is, a trade of size $2 million counts twice as much as a trade of size $1 million. For blocks, whose reported sizes are capped at $5 million (IG blocks) and $1 million (HY blocks), we use a proxy size given by the average monthly capped block size. This is disseminated by FINRA in their Capped Volume Report.
Note that we are looking at the side-aligned difference, so that for both buy and sell trades, PT outperformance shows up as a positive cost relative to IBVAL, and PT underperformance shows up as negative cost relative to IBVAL.
PTs that are predominantly dealer-buy or dealer-sell have slightly different economics, so we further tag a PT with at least 80% dealer–buy line-items as a dealer-buy PT, similarly for dealer-sell. Mixed PTs are dropped for simplicity.
Finally, we use linear regression to see the effect of the number of blocks (X-axis) on PT cost (Y-axis). To mitigate outlier trades, we apply quantile regression which finds a best linear fit for the median PT cost (typical linear regression targets the mean which is more heavily impacted by outliers). In addition, we only look at PTs with at least one IG block.
Key findings
Let’s look at monthly results for TRACE trades in Q2 2025.
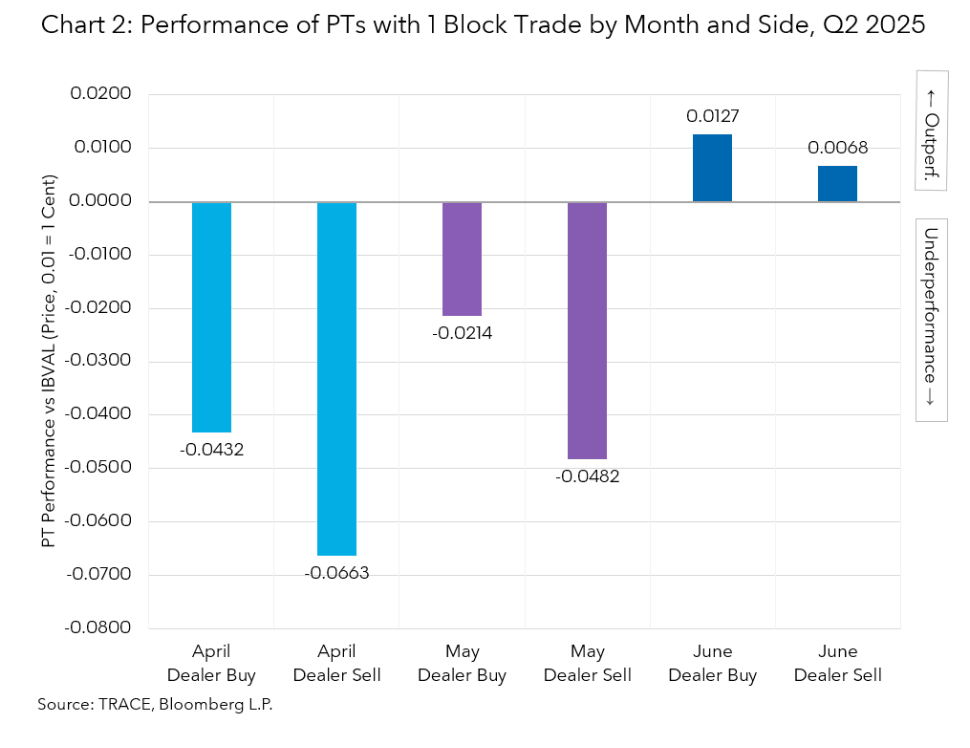
Starting with the PTs that had exactly 1 block trade, we can calculate their cost (not just the cost of the blocks by themselves) to establish a baseline. This is the Y-value of the linear regression fit where the X-value is 1. These are shown in Chart 2, segmented by month and side.
We can see that for April, for example, PTs with 1 block trade had underperformed IBVAL by 4-6 cents (depending on the side). Those economics improved in May, and then improved sufficiently further in June to actually outperform IBVAL. In all months, we can see more favorable terms for dealer buys (client sells) vs dealers sells (client buys), suggesting dealers have been better buyers across a range of recent market conditions.
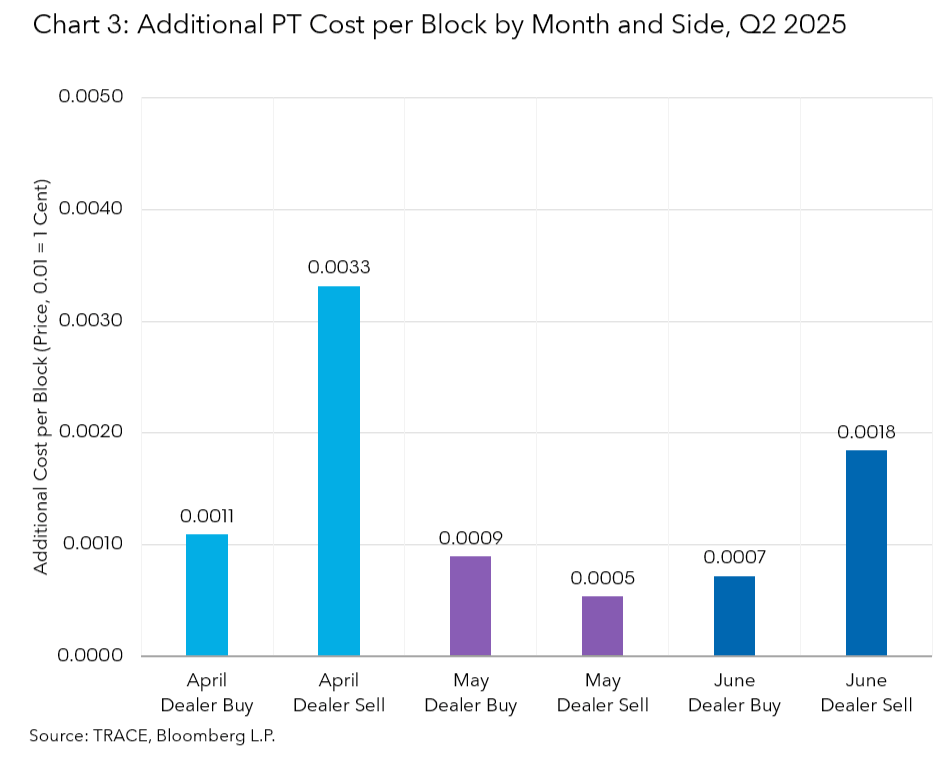
With the 1 block baseline set, we can look at PTs with more than 1 block. Here, it is more practical (and useful) to examine the “additional PT cost per block” (rather than the outright PT cost vs IBVAL). This naturally falls out as the slope of the linear regression fit. The results for additional PT cost per block are shown in Chart 3, which are then segmented by month and side.
We can use April Dealer Buys to illustrate how to put the findings to work. There we see 0.0011, which means that for each additional block in a PT trade, the expected median PT performance (as defined above) would decline by $0.0011. For 10 additional block trades, the decline would be 10 x $0.0011= $0.0110, or 1.1 cents.
From here, we can see that the Dealer Buy cost for additional blocks declines from 0.0011 in April, to 0.0009 in May, and then to 0.0007 in June. That’s a significant cost reduction of 36% in just 3 months.
Dealer Sells demonstrate a distinct profile. First, they have generally followed the same declining cost trend: 0.033 in April, 0.0005 in May (which seems to be an outlier), and 0.0018 in June. That too is a significant cost reduction of 45% in just 3 months (skipping over May). However, the additional cost per block for Dealer Sells is roughly 2.5-3x higher than Dealer Buys: 0.0033 vs. 0.0011 in April, and 0.0018 vs 0.0007 in June (again, skipping over May).
Note that the additional costs computed here are for the overall PT, not just for the additional block or just the block line items. Stated differently, each additional block added to a PT increases the expected cost for all trades in that PT.
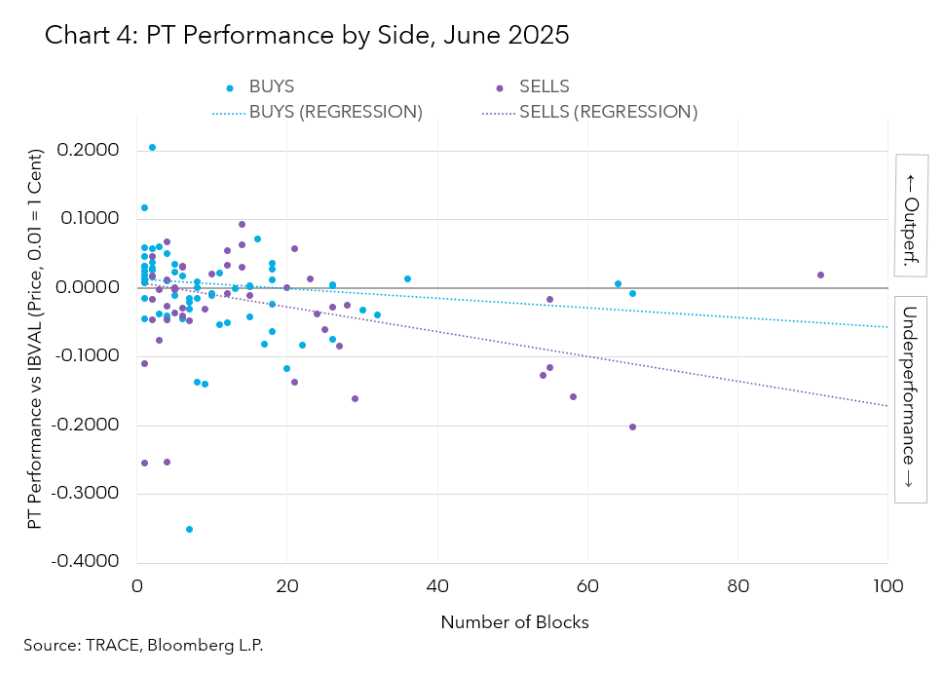
Lastly, Chart 4 plots the more granular results for June – PTs (with block trades) vs PT cost (as defined above) – along with the regression fit itself, segmented by side. The slope of the regression line is the additional PT cost per block.
Traders continue to leverage PTs in new ways to meet their trading objectives, and US investment grade blocks are no exception. Although they are a significant part of the market, blocks remain the most challenging to price right and their inclusion in PTs has introduced another layer of complexity. The results shown here begin to shed light on the market’s recent performance in this segment, and position traders to make the best use of available tools to achieve optimal outcomes.
Interested in learning more about using IBVAL for your pricing needs? Click here.
The data included in these materials are for illustrative purposes only. The BLOOMBERG TERMINAL service and Bloomberg data products (the “Services”) are owned and distributed by Bloomberg Finance L.P. (“BFLP”) except (i) in Argentina, Australia and certain jurisdictions in the Pacific Islands, Bermuda, China, India, Japan, Korea and New Zealand, where Bloomberg L.P. and its subsidiaries (“BLP”) distribute these products, and (ii) in Singapore and the jurisdictions serviced by Bloomberg’s Singapore office, where a subsidiary of BFLP distributes these products. BLP provides BFLP and its subsidiaries with global marketing and operational support and service. Certain features, functions, products and services are available only to sophisticated investors and only where permitted. BFLP, BLP and their affiliates do not guarantee the accuracy of prices or other information in the Services. Nothing in the Services shall constitute or be construed as an offering of financial instruments by BFLP, BLP or their affiliates, or as investment advice or recommendations by BFLP, BLP or their affiliates of an investment strategy or whether or not to “buy”, “sell” or “hold” an investment. Information available via the Services should not be considered as information sufficient upon which to base an investment decision. The following are trademarks and service marks of BFLP, a Delaware limited partnership, or its subsidiaries: BLOOMBERG, BLOOMBERG ANYWHERE, BLOOMBERG MARKETS, BLOOMBERG NEWS, BLOOMBERG PROFESSIONAL, BLOOMBERG TERMINAL and BLOOMBERG.COM. Absence of any trademark or service mark from this list does not waive Bloomberg’s intellectual property rights in that name, mark or logo. All rights reserved. © 2025 Bloomberg.
BVAL, IBVAL and BVAL Derivatives (collectively, “BVAL”) are services provided by Bloomberg Finance L.P. and its affiliates (“Bloomberg”). BVAL valuations do not express an opinion on the future or projected value of any instrument and are not investment recommendations (i.e., recommendations as to whether or not to “buy,” “sell,” “hold,” or to enter or not to enter into any other transaction involving any specific interest), a recommendation as to an investment or other strategy, or commodity trading advice. No aspect of the BVAL valuation or other data is based on the consideration of a customer’s individual circumstances and information available via BVAL should not be considered as information sufficient upon which to base an investment decision. Customers should determine on their own whether they agree with BVAL valuations. BVAL may not be available in certain jurisdictions. BVAL is not recognized or licensed as an official pricing provider in any jurisdiction, and should not be relied upon to comply with any laws or regulations that prescribe the use of prices issued by authorized pricing providers. BVAL should not be construed as tax, accounting, legal or regulatory advice or opinions, or sufficient to satisfy any tax, accounting, legal or regulatory requirements. Customers are solely responsible for the selection and use of appropriate parameters, inputs, models, formulas and data for meeting their tax, accounting, legal or regulatory requirements. Bloomberg believes that the information it uses in providing the BVAL services comes from reliable sources, but does not guarantee BVAL’s accuracy. Employees involved in the BVAL services may hold positions in the securities included in the BVAL services.
BVAL valuations may include indices, rates or other values (collectively, “Values”) that could be considered ‘benchmarks’ under the EU and/or UK benchmark regulation and/or similar regulation (collectively, “BMR”) if used in a regulated manner. Customers may not use Values in any manner that could be construed as regulated ‘use’ as a benchmark under the BMR (including to determine the value of financial instruments, to measure the performance of an investment fund for the purpose of tracking the return of such Value, to define the asset allocation of a portfolio, or to compute performance fees) unless such Values are administered by an authorized or registered administrator of such Values under the BMR. Among Bloomberg and its affiliates, only Bloomberg Index Services Limited (BISL) is an authorized or registered administrator of such Values under the BMR. BISL and Additional Data providers of such Values may require direct licensing with customers depending on customers’ use.
