Bloomberg Professional Services
This article was written by Bora Dirik, Product Manager, BVAL End of Day Liquid Credit and Government at Bloomberg.
Turbulence has defined the start of 2025, as global markets faced a spike in volatility and significant volume increases across asset classes. From the lingering effects of geopolitical tensions to unexpected shifts in policies, investors have been navigating a truly unpredictable landscape. This isn’t just about minor jitters; we’ve seen everything from sharp equity market corrections to sudden movements in commodity prices, all contributing to a sense of unease. Investors, particularly those managing large portfolios of fixed income securities, are keenly aware that the prices are constantly reacting to a complex interplay of factors.
PRODUCT MENTIONS
In such dynamic conditions, simply looking at an evaluated price isn’t enough. Therefore, fixed income investors are seeking clarity that goes beyond surface-level valuation. This article looks at how transparency can be achieved with measures like the BVAL Score to help risk managers, portfolio teams, and governance leads assess the strength of the data behind the valuation, especially when market conditions are in flux.
Zooming in on transparency
Firstly, let’s look at what price transparency measures mean using the example of BVAL Score. Bloomberg Evaluated Pricing Service (BVAL) is a proprietary metric that signals the relative strength of the market inputs used to produce an evaluated price. While not a measure of pricing accuracy, the BVAL Score is a highly useful indicator of used data abundance and its concentration.
Within a range from 1 to 10, higher scores reflect more corroborated and consistent market data. A lower score does not necessarily indicate a poor price, particularly when pricing is based on high-quality comparables, but instead signals reduced direct observation or greater variability in observed inputs. For an in-depth look at BVAL Score click here.
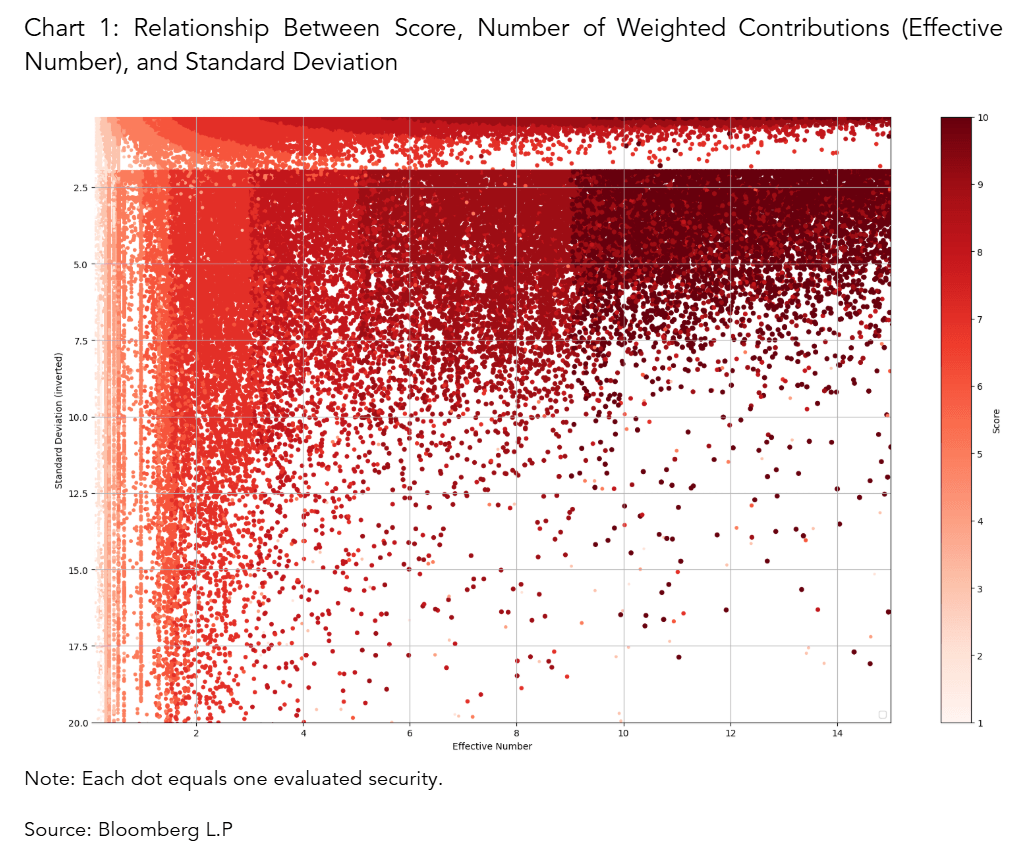
Securities with a higher number of reliable observations and lower dispersion tend to achieve higher BVAL Scores. This confirms that the Score reflects the underlying market agreement, not price validity.
Tracking shifting market inputs
To show how the BVAL Score provides price transparency in practice, we looked at US investment-grade corporate bonds in the Bloomberg U.S. Corporate Bond Index (LUACTRUU, calculated by Bloomberg Index Services Limited “BISL” ) across a six-month period, to paint a picture of the magnitude of the market turbulence and read through BVAL metrics.
During the week of April 7th, volatility in index-eligible U.S. investment-grade bonds nearly doubled and remained elevated for several days before settling at a higher plateau. While the number of contributing sources remained stable, continuously hovering at 70 handle.
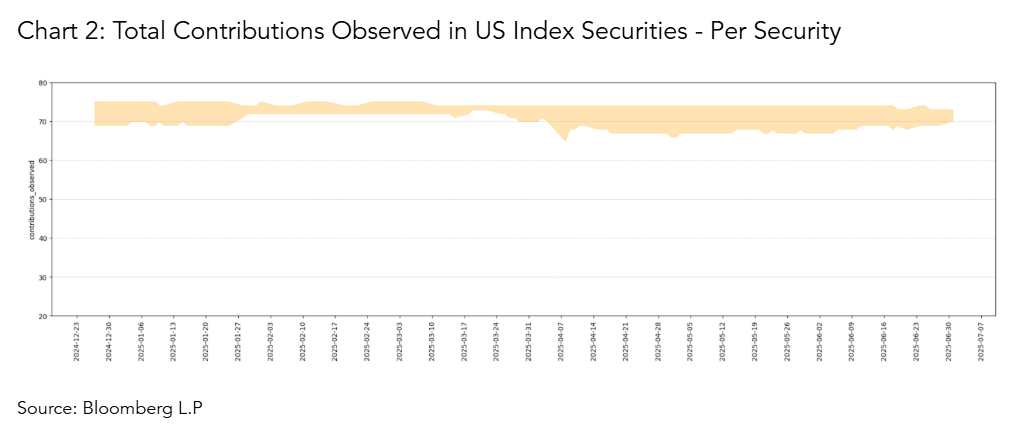
Although the total contributions showed no significant change, we observed a notable drop in the number of corroborating contributions, which fell from its average of 18 to 12, before bouncing back to its usual levels.
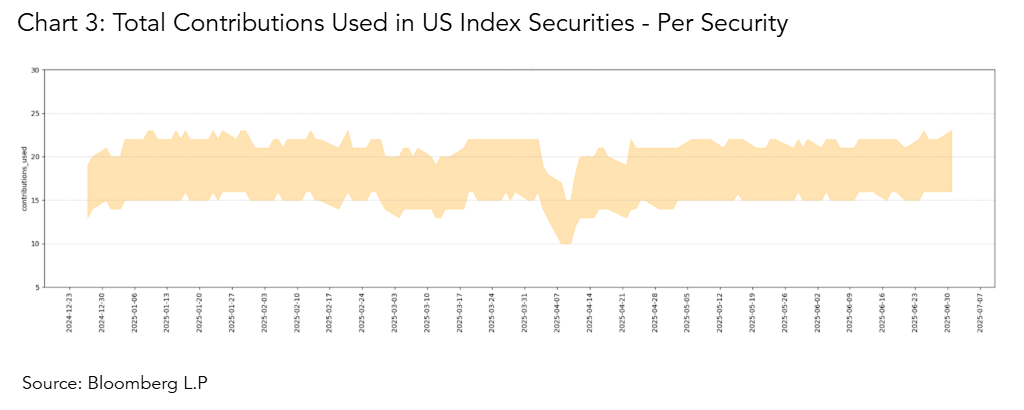
This shift highlights that volatility did not necessarily reduce market participation but did erode market consensus at a certain price level.
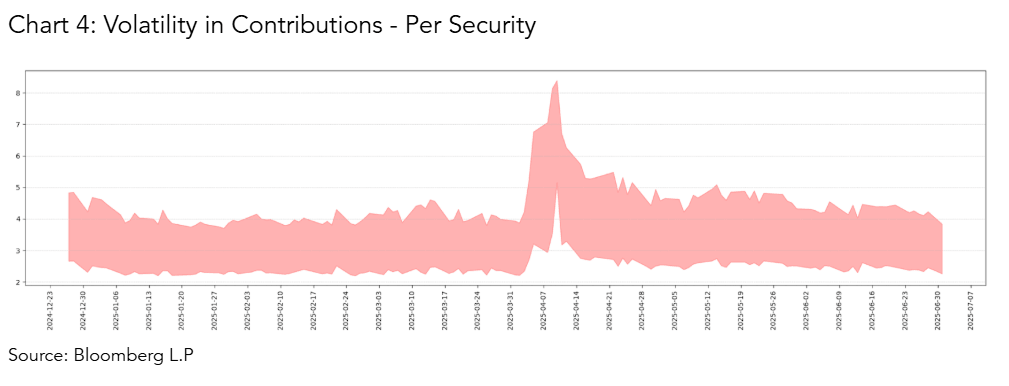
As dispersion among observations increased, the agreement around specific price levels weakened, BVAL Score reflects this loss of alignment. Score for these securities temporarily pulled back before rebounding, a reflection of the same data dynamics observed in tick count and contributor activity. This shift was not due to valuation instability, but rather to changes in the underlying market inputs, as consensus among available observations weakened despite steady contributor activity. The deviation was primarily influenced by a noticeable increase in the volatility of market observations, coupled with a decline in the number of corroborating observable market inputs.
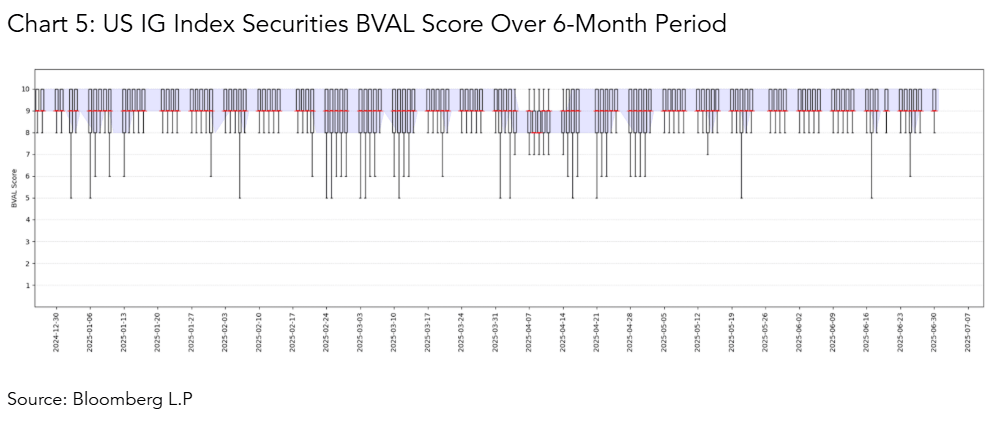
These dynamics underscore how the BVAL Score reflects changes in market depth and consensus. When liquidity tightens, observed trades and quotes tend to fragment or in some cases vanish entirely reducing both the quantity and consistency of data that support pricing. BVAL Score captures these subtle but important shifts, alerting clients to moments when pricing may rely more heavily on less direct or more varied market inputs.
Interested to learn more about using IBVAL for your pricing needs? Click here.
The data included in these materials are for illustrative purposes only. The BLOOMBERG TERMINAL service and Bloomberg data products (the “Services”) are owned and distributed by Bloomberg Finance L.P. (“BFLP”) except (i) in Argentina, Australia and certain jurisdictions in the Pacific Islands, Bermuda, China, India, Japan, Korea and New Zealand, where Bloomberg L.P. and its subsidiaries (“BLP”) distribute these products, and (ii) in Singapore and the jurisdictions serviced by Bloomberg’s Singapore office, where a subsidiary of BFLP distributes these products. BLP provides BFLP and its subsidiaries with global marketing and operational support and service. Certain features, functions, products and services are available only to sophisticated investors and only where permitted. BFLP, BLP and their affiliates do not guarantee the accuracy of prices or other information in the Services. Nothing in the Services shall constitute or be construed as an offering of financial instruments by BFLP, BLP or their affiliates, or as investment advice or recommendations by BFLP, BLP or their affiliates of an investment strategy or whether or not to “buy”, “sell” or “hold” an investment. Information available via the Services should not be considered as information sufficient upon which to base an investment decision. The following are trademarks and service marks of BFLP, a Delaware limited partnership, or its subsidiaries: BLOOMBERG, BLOOMBERG ANYWHERE, BLOOMBERG MARKETS, BLOOMBERG NEWS, BLOOMBERG PROFESSIONAL, BLOOMBERG TERMINAL and BLOOMBERG.COM. Absence of any trademark or service mark from this list does not waive Bloomberg’s intellectual property rights in that name, mark or logo. All rights reserved. © 2025 Bloomberg.
BVAL, IBVAL and BVAL Derivatives (collectively, “BVAL”) are services provided by Bloomberg Finance L.P. and its affiliates (“Bloomberg”). BVAL valuations do not express an opinion on the future or projected value of any instrument and are not investment recommendations (i.e., recommendations as to whether or not to “buy,” “sell,” “hold,” or to enter or not to enter into any other transaction involving any specific interest), a recommendation as to an investment or other strategy, or commodity trading advice. No aspect of the BVAL valuation or other data is based on the consideration of a customer’s individual circumstances and information available via BVAL should not be considered as information sufficient upon which to base an investment decision. Customers should determine on their own whether they agree with BVAL valuations. BVAL may not be available in certain jurisdictions. BVAL is not recognized or licensed as an official pricing provider in any jurisdiction, and should not be relied upon to comply with any laws or regulations that prescribe the use of prices issued by authorized pricing providers. BVAL should not be construed as tax, accounting, legal or regulatory advice or opinions, or sufficient to satisfy any tax, accounting, legal or regulatory requirements. Customers are solely responsible for the selection and use of appropriate parameters, inputs, models, formulas and data for meeting their tax, accounting, legal or regulatory requirements. Bloomberg believes that the information it uses in providing the BVAL services comes from reliable sources, but does not guarantee BVAL’s accuracy. Employees involved in the BVAL services may hold positions in the securities included in the BVAL services.
BVAL valuations may include indices, rates or other values (collectively, “Values”) that could be considered ‘benchmarks’ under the EU and/or UK benchmark regulation and/or similar regulation (collectively, “BMR”) if used in a regulated manner. Customers may not use Values in any manner that could be construed as regulated ‘use’ as a benchmark under the BMR (including to determine the value of financial instruments, to measure the performance of an investment fund for the purpose of tracking the return of such Value, to define the asset allocation of a portfolio, or to compute performance fees) unless such Values are administered by an authorized or registered administrator of such Values under the BMR. Among Bloomberg and its affiliates, only Bloomberg Index Services Limited (BISL) is an authorized or registered administrator of such Values under the BMR. BISL and Additional Data providers of such Values may require direct licensing with customers depending on customers’ use.
