
Bloomberg Professional Services
- Rapid debt growth has historically been followed by weaker excess returns among US investment-grade issuers, even when issuers had similar spread-duration exposure.
- High-debt-growth issuers accounted for 50% of cumulative index tail damage despite representing 29% of benchmark exposure.
- The combination of issuer size and rapid debt growth may be particularly relevant as AI-related investment drives a new wave of corporate borrowing.
This article was written by Vikas Jain, Index Quant Research and Yingjin Gan, Head of Index Research at Bloomberg.
Concentration risk is usually associated with equity benchmarks. Corporate bond indices are considerably more dispersed, and our previous research found little evidence that larger investment–grade issuers systematically deliver weaker returns. Market–value weighting also aligns benchmark exposure with the investable market, liquidity and available capacity.
PRODUCT MENTIONS
Yet the same construction links benchmark weights directly to borrowing. When an issuer adds index–eligible debt, its benchmark weight rises, all else equal. A large, established debt may simply reflect a financing structure that the business has supported for many years. Meanwhile, rapid debt growth changes the issuer’s financing profile, and the additional borrowing still needs to be supported by future cash flows.
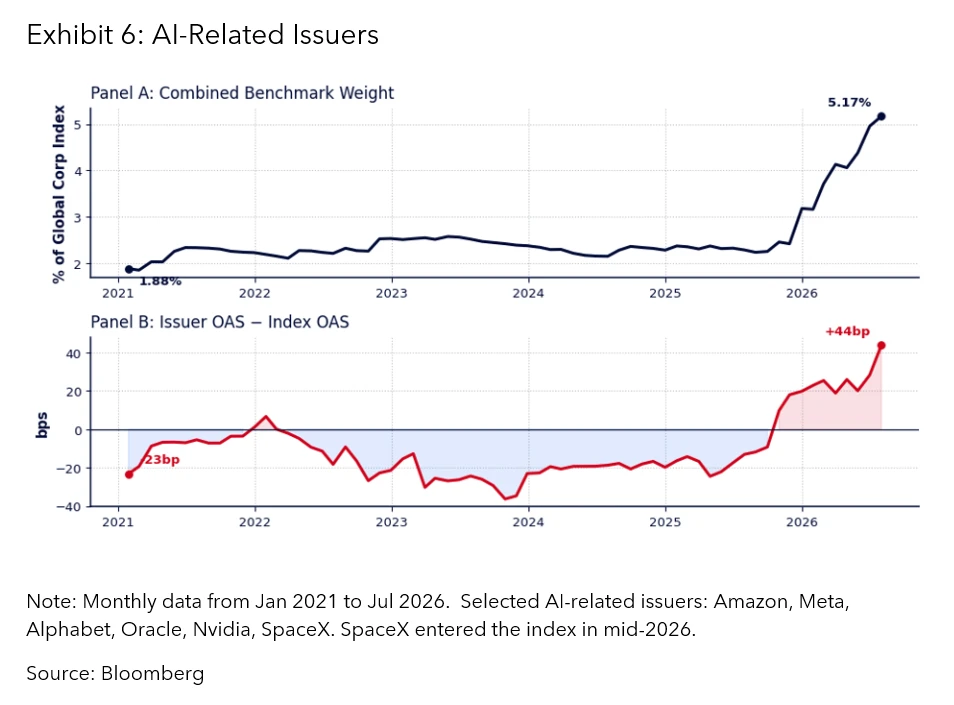
That distinction matters more in the current AI investment cycle, as AI-related capex drives a new wave of corporate borrowing. Six selected issuers – Amazon, Meta, Alphabet, Oracle, Nvidia and SpaceX – increased their combined weight in the Bloomberg Global Corporate Index from 2.24% in August 2025 to 5.17% in July 2026. Together, they represented roughly 20% of net issuance over the period.
This article looks at whether rapid debt growth has historically been followed by weaker credit performance, how issuer size can affect the benchmark impact and what the findings could mean amid the current AI-related issuance cycle.
Is rapid debt growth followed by weaker returns historically?
Much of the debate around bond–index construction has focused on whether market–value weighting “rewards” the most indebted borrowers. Our earlier work suggests that this concern is less important than it may first appear, particularly in investment grade. Reducing issuer concentration substantially had little effect on historical US investment grade (IG) excess returns.
This analysis focuses instead on change: whether rapid growth in an issuer’s debt is followed by weaker credit performance.
We examine US investment-grade issuers and measure the trailing 12-month change in each issuer’s amount outstanding. We then group issuers by debt growth and compare their subsequent excess returns, before examining sector composition, issuer size and tail events.
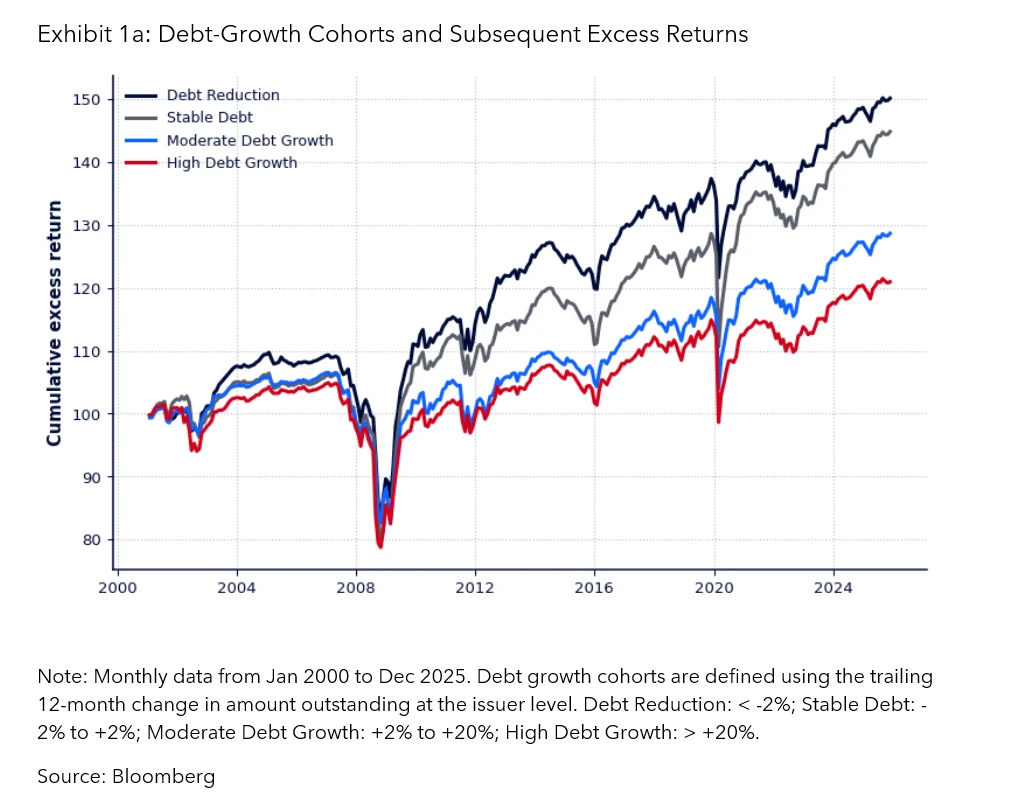
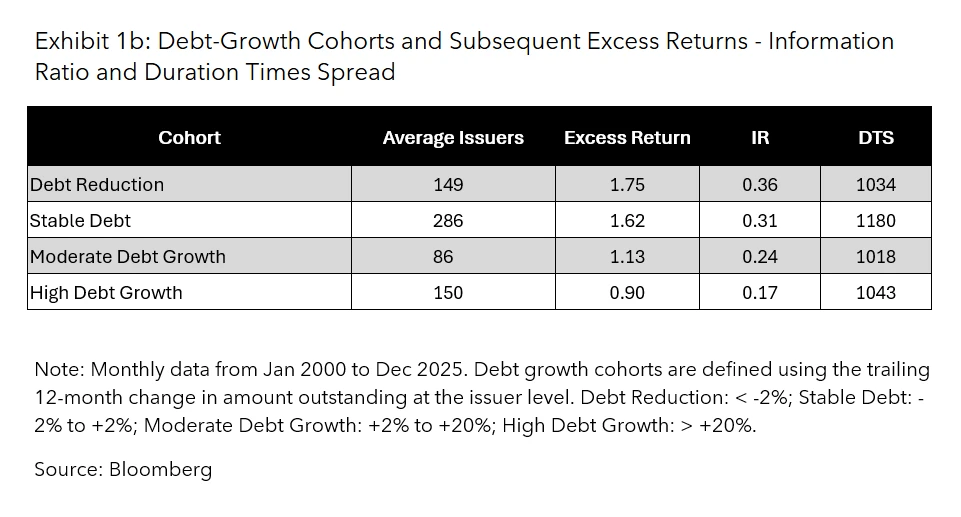
Issuers reducing their debt generated annualised excess returns of 1.75%, compared with 0.90% for issuers whose amount outstanding increased by more than 20%. Issuers with broadly stable debt also performed better than those experiencing faster growth.
The two extreme cohorts carried very similar spread duration exposure, so the return gap does not appear to be explained by credit beta alone. This differs from the earlier size result, where credit quality differences explained part of the return pattern. Here, the extreme debt growth cohorts have similar spread-duration exposure. The same ordering remains when issuers are compared within rating groups.
The result is similar when debt growth is measured relative to the market rather than using fixed cut-offs. Repeating the analysis for the Bloomberg Global Corporate Index also produced a similar pattern across debt-growth cohorts.
Issuance tends to arrive in clusters
Corporate borrowing is rarely distributed evenly across the market. Financing cycles concentrate in different sectors depending on the prevailing environment. Even within a sector, issuance can be concentrated in a small number of borrowers.
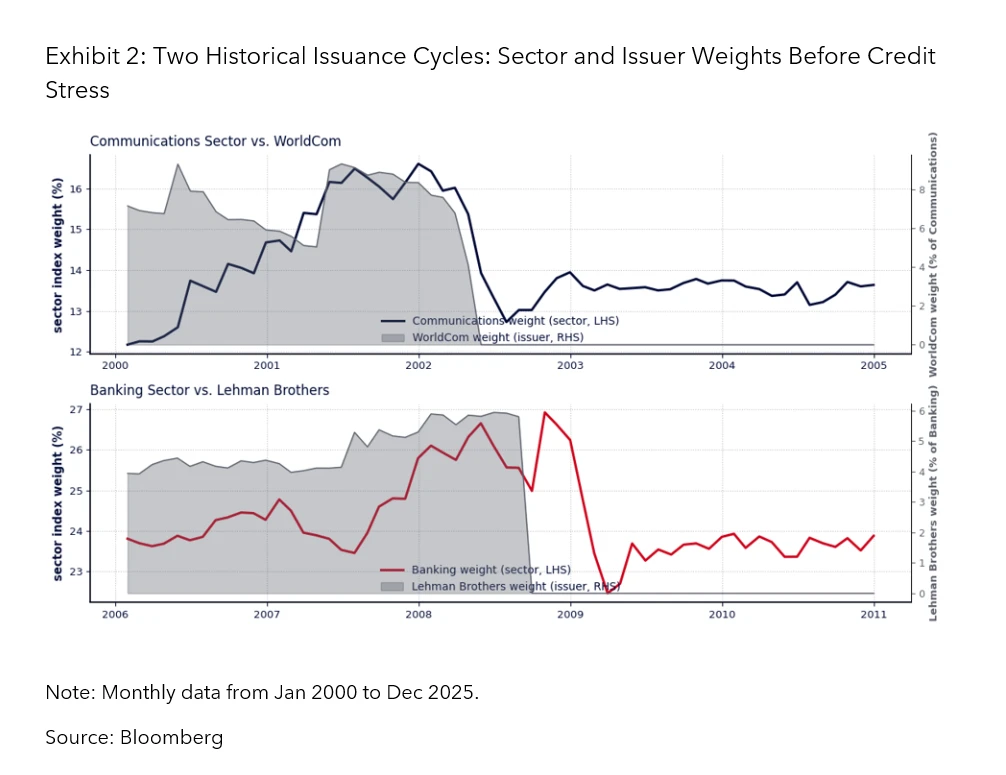
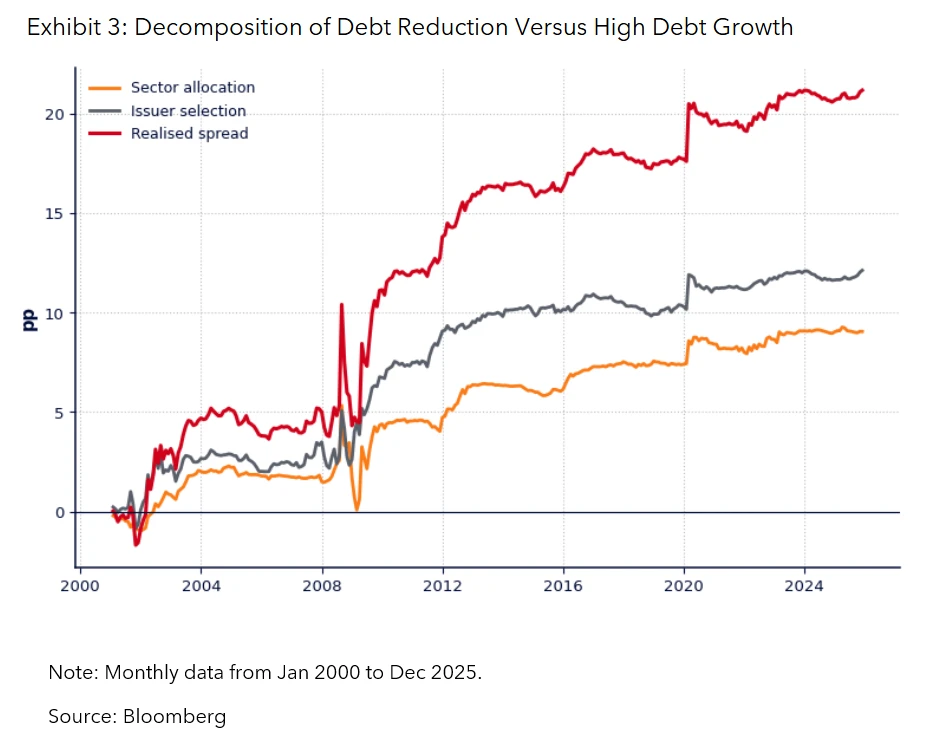
Sector weights historically differed across the debt growth portfolios over parts of the sample. Roughly half of the historical return spread between the debt–reduction and high–debt–growth cohorts is attributable to differences in sector weights, although much of this was associated with the banking cycle around the global financial crisis. The remaining return differential arises within sectors, suggesting that the result is not solely a sector–allocation effect.
How is debt growth related to tail risk?
The historical record includes familiar episodes. WorldCom and Lehman were both in debt-growing cohorts before their subsequent tail events, with Lehman among the largest high-growth losses in the sample.
More broadly, issuers with growing debt accounted for 71% of cumulative index tail damage, while the high-growth cohort alone contributed 50% of damage despite representing only 29% of benchmark exposure. But debt growth does not capture every credit event, as 29% of historical tail damage came from issuers whose balance sheets were stable or shrinking.
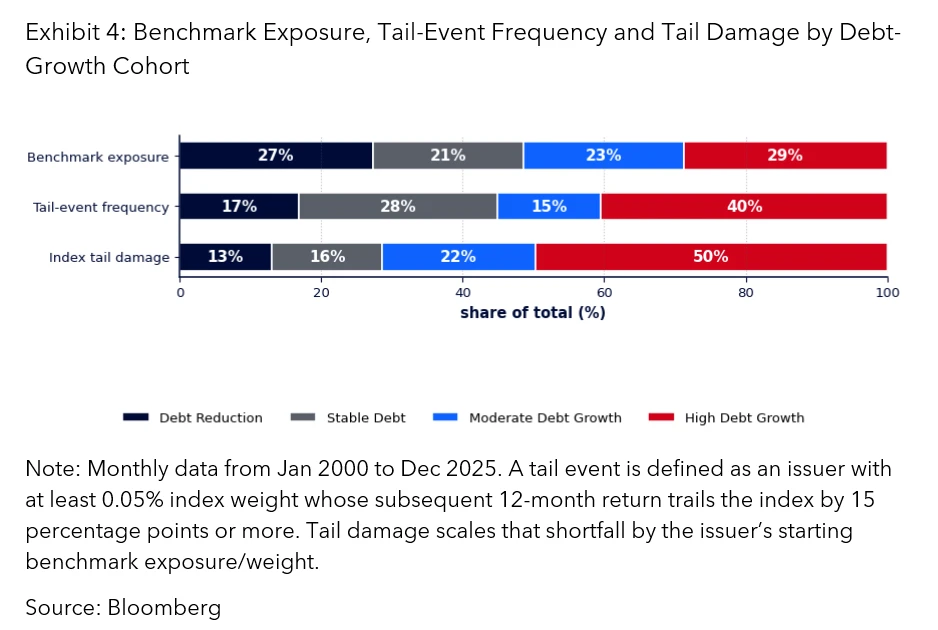
Credit returns are tail–driven, and a small number of rating migrations and credit events explain a meaningful share of the result. Where additional borrowing raises leverage, weakens interest coverage or reduces balance–sheet flexibility, credit deterioration can follow. But issuance can also be a symptom rather than a cause: companies may borrow because fundamentals are weakening, acquisitions are underway or liquidity needs are rising.
How do issuer size and debt growth interact?
Size alone told us relatively little about subsequent IG returns. The stronger result appears when size and growth are considered together.
Within each size group, higher debt growth was followed by weaker excess returns. The gap also increased with issuer size, from roughly 0.5 percentage points among smaller issuers to around 0.8 percentage points among the largest. Debt growth tells us how quickly an issuer’s financing profile is changing; size tells us how much that change matters for the index.
The tail results make the size effect clearer. Smaller high-growth issuers had tail events relatively often, but their small benchmark weights limited the index impact. Large high-growth issuers did not have dramatically more tail events, but the events mattered much more when they occurred.
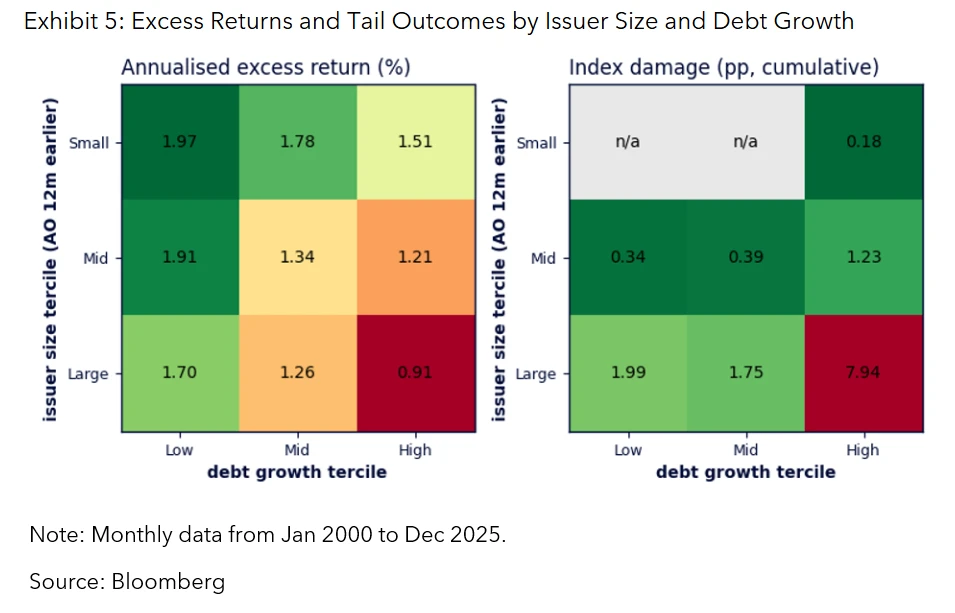
Debt growth shows where financing profile is changing, while size determines how much that risk matters to the benchmark.
What the historical evidence means for today’s AI issuance cycle
Neither size nor debt growth is a problem on its own. The more interesting case is an issuer that is already a meaningful benchmark weight and is adding debt quickly.
The selected AI-related issuers’ credit spreads have widened recently. Within the Bloomberg Global Corporate Index, the group’s OAS moved from 23bp tighter than the index in January 2021 to 44bp wider by July 2026, while their combined benchmark weight rose from 1.88% to 5.17%. Most of both moves occurred over the past year.
Precision and customization in fixed income indexing
Amount outstanding, however, captures only direct bond-market financing. AI infrastructure can also be funded through joint ventures, project-finance vehicles, leases, private credit and other channels. Some of that debt sits outside the corporate issuer, while lease and purchase commitments may not appear in issuer-level bond amount outstanding. Direct corporate debt therefore tells only part of the story and may understate the broader financing commitments.
Index design can also change how quickly new debt enters the portfolio. New issuance can be phased in, high-growth issuers can be underweighted or excluded, or optimisation can be used to keep the portfolio close to the parent benchmark. Each approach involves a trade-off between reducing debt-growth exposure, turnover and benchmark deviation.
The trade-offs between debt-growth exposure, turnover and benchmark deviation highlight the importance of defining benchmark exposures in line with specific investment objectives.
As portfolio construction becomes more targeted, defining benchmark exposures with precision is becoming increasingly important. Bloomberg Fixed Income Indices give investors tools to tailor exposures consistently and transparently . Supported by integrated data and analytics on the Bloomberg Terminal, users can combine asset classes, apply constraints and refine methodologies in line with specific investment objectives.