
Bloomberg Professional Services
- In the past two decades, the US fixed income market has almost quadrupled, expanding from traditional government and investment-grade debt into a $40+ trillion market today spanning credit, rates and securitized assets.
- Certain fixed income segments once considered niche or specialized have increasingly become mainstream allocations in institutional portfolios.
- The Bloomberg US Total Fixed Income Market Index (TOTALFI) reflects this broader opportunity set within a single rule-based framework, capturing today’s investable universe.
The US fixed income market looks very different today than it did several decades ago. A market that used to be centered primarily around US Treasuries and investment-grade corporate borrowing has expanded into a more complex and accessible credit landscape.
This evolution was driven by two primary factors: borrowing needs from governments and corporations increased substantially, and segments once considered more specialized, such as high yield credit, leveraged loans and Treasury Inflation-Protected Securities (TIPS), have developed into institutionalized asset classes. Alongside this, advances in trading protocols, enhanced liquidity and improved transparency of pricing and data have increased accessibility for many fixed income segments once considered challenging to transact in.
PRODUCT MENTIONS
The result is a market today that is not only larger in size, but offers greater breadth of exposure across issuers, credit profiles and financing structures. The Bloomberg US Total Fixed Income Market Index (TOTALFI) was built around this expanded reality, bringing legacy core sectors and newer institutional credit markets into a single framework.
This article looks at how the US fixed income market has expanded, how previously specialized segments developed into institutional asset classes and how TOTALFI brings this broader opportunity set together within a single framework.
How has the fixed income market expanded in scale and scope in the last two decades?
The scale of that change can be seen across the largest parts of the US fixed income market. The Bloomberg US Treasury Index has grown from $2.1 trillion in 2006 to $14.2 trillion today, while the Bloomberg US Investment Grade Corporate Index grew more than 4x in market value, from $1.6 trillion to $7.3 trillion over the same period. Agency mortgage-backed securities have grown from $3.5 trillion 20 years ago to $7.6 trillion today, according to Bloomberg data (index market value as of September 29, 2006 and September 30, 2026, respectively). Taken together with growth across other credit markets, the investable US fixed income universe is now nearly four times the size it was 20 years ago.
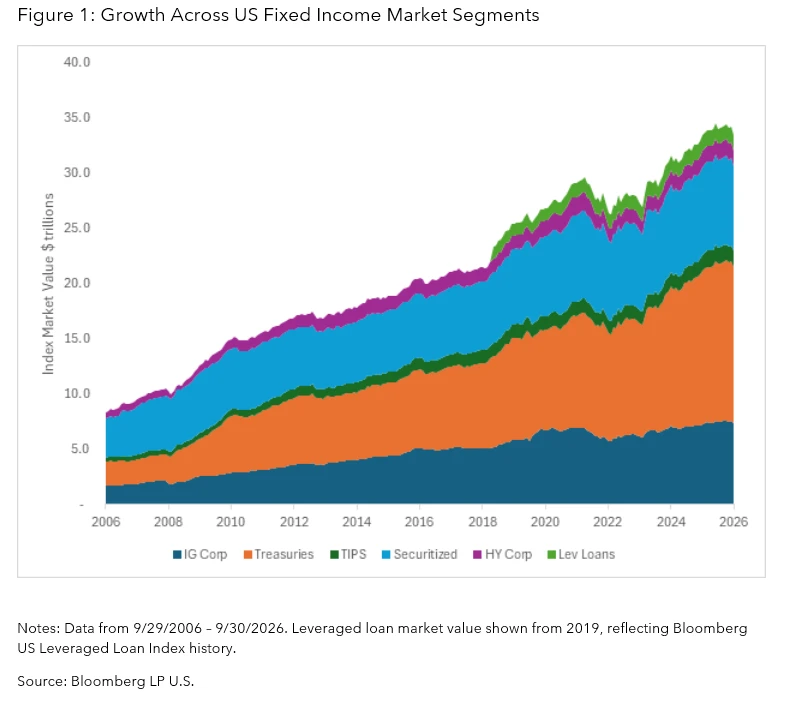
Growing government financing needs contributed to a significant expansion in Treasury issuance, particularly around major economic shocks such as the global financial crisis and the pandemic. Corporate issuers also made greater use of increasingly deep debt capital markets to fund investment, acquisitions and refinancing. Extended periods of low interest rates provided corporate borrowers with an opportunity to lock in historically low financing costs, including further out the maturity curve.
While growth in corporate and government debt has contributed to the size of today’s fixed income market, it only tells part of the story. Just as important, capital markets expanded to finance a much broader range of assets and activities. Below-investment grade companies gained access to institutional capital through high yield debt and loan issuance. Mortgage securitization increasingly connected capital markets with the residential and commercial housing markets. Asset-backed securitization transformed auto loans, credit card receivables and other consumer cash flows into institutional securities.
Notably, the market therefore expanded not only through additional issuance, but also through the development of financing for a broader range of economic activity.
How did specialized markets become institutional asset classes?
High yield provides one of the clearest examples of how the fixed income market has broadened over time. Prior to the development of the modern high yield market, below-investment grade companies had more limited access to public debt markets and relied more heavily on bank financing. That began to change in the late 1970s and 1980s, as original-issue high yield created a new source of financing for lower-rated companies.
According to the US Government Accountability Office, the high yield market grew from just $9 billion in 1977 to $180 billion in 1988. Following this, high yield infrastructure started taking shape in the form of dedicated credit managers, expansion of credit research capabilities, electronic trading and improved liquidity. Today, the Bloomberg US Corporate High Yield Bond Index represents $1.4 trillion across nearly 2,000 securities.
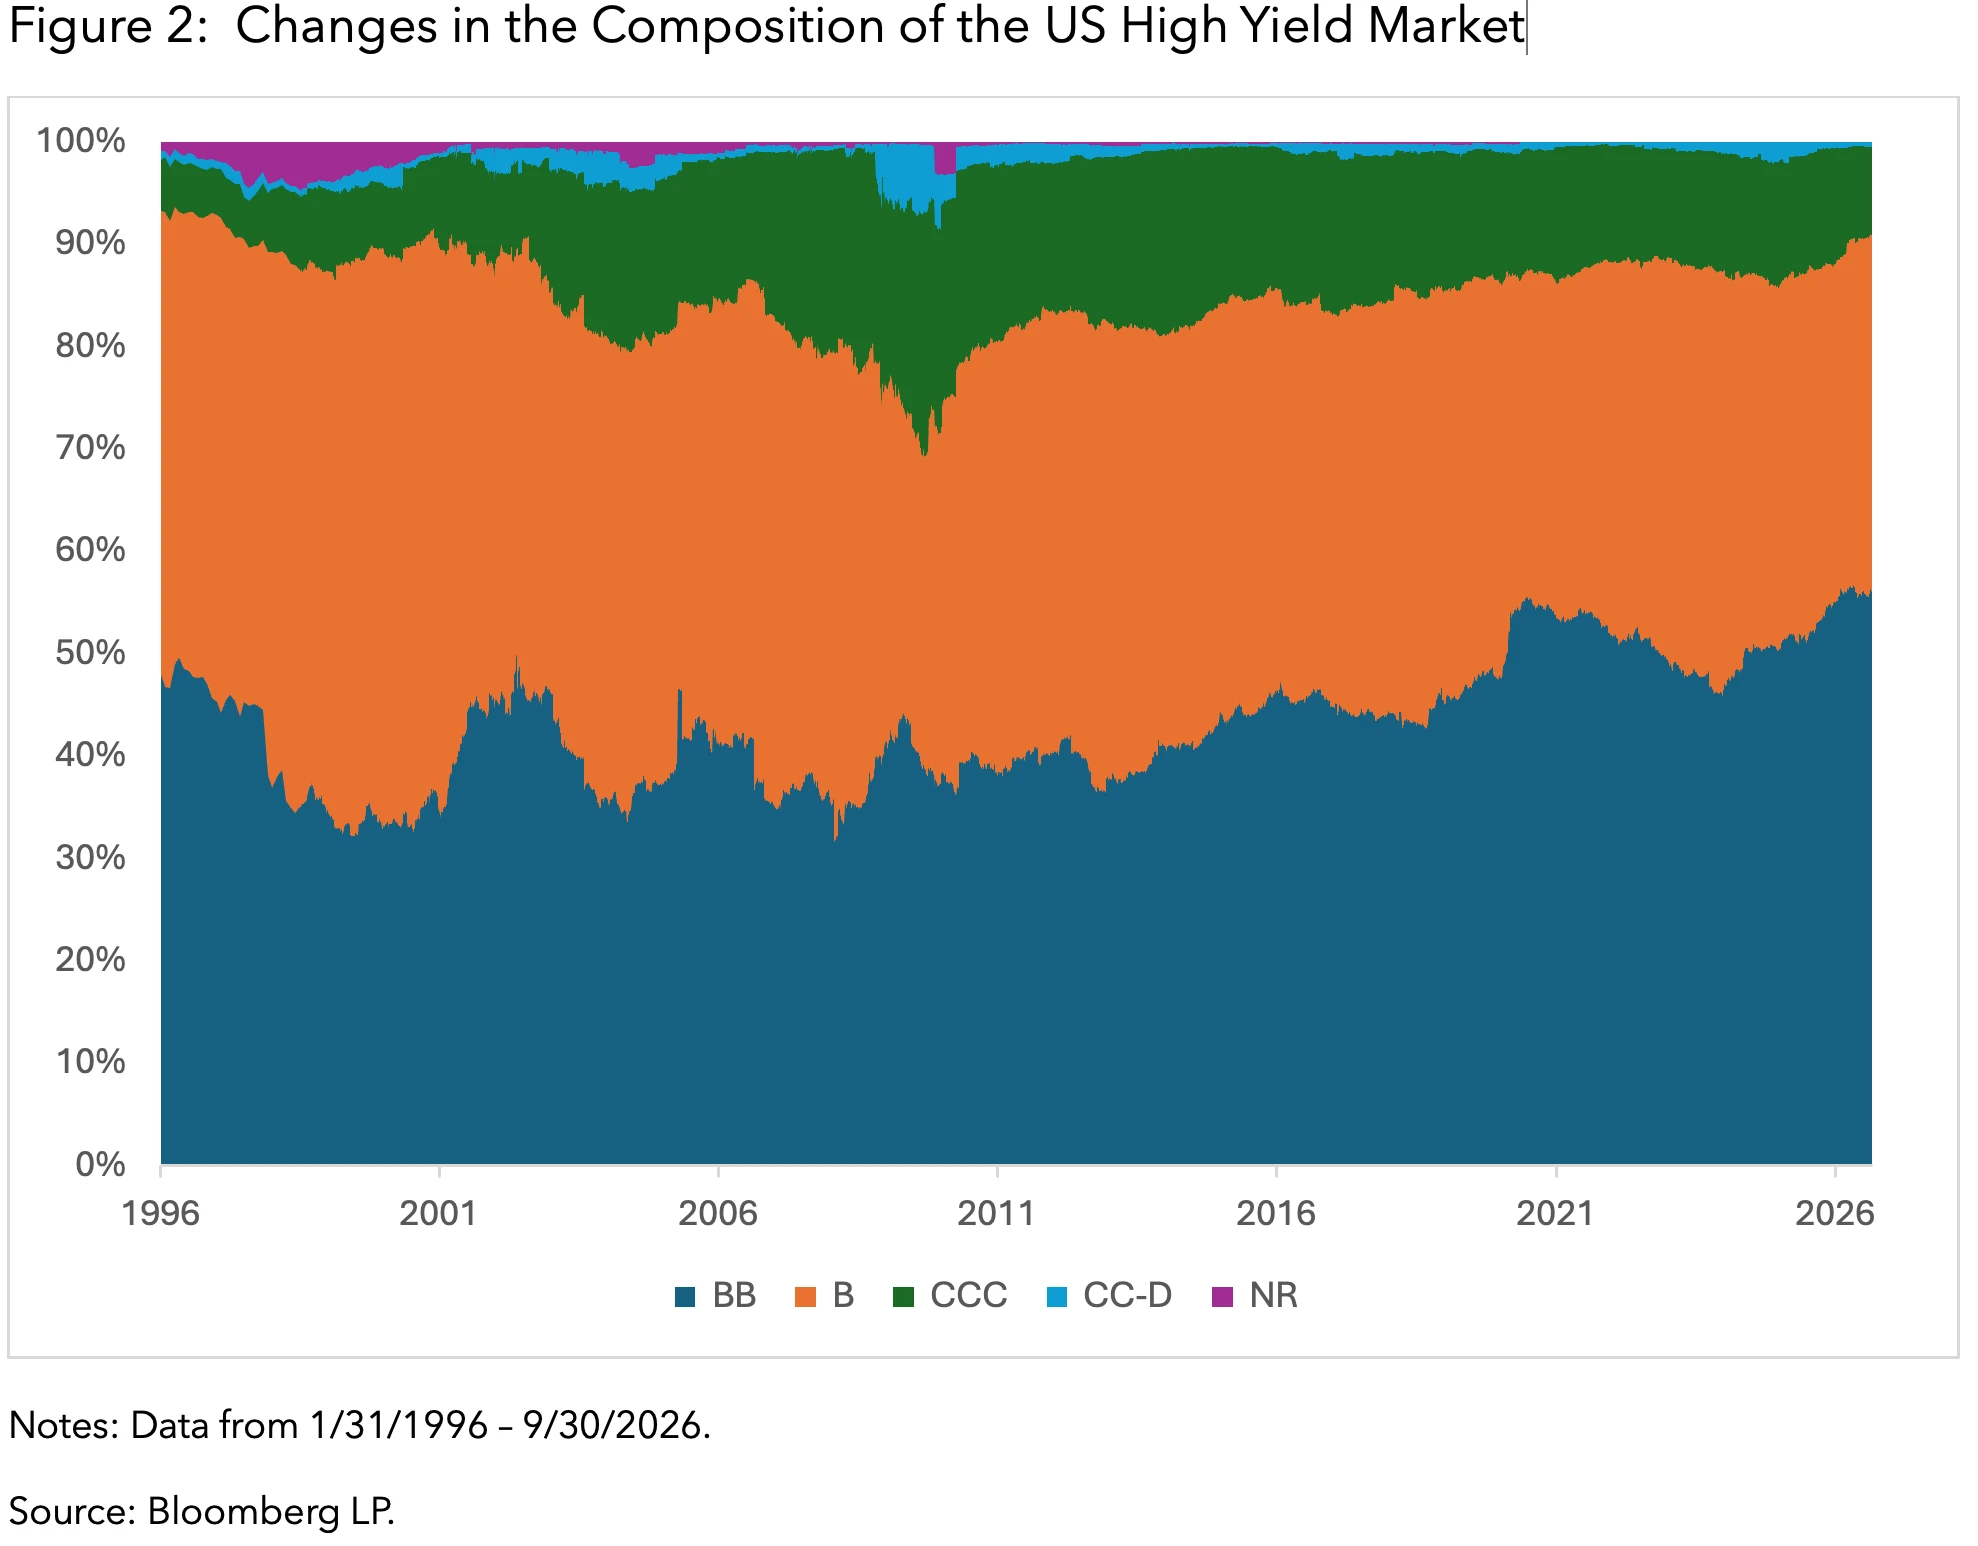
The composition of the high yield market has also changed. BB-rated bonds represented less than 40% of high yield before the global financial crisis, compared with roughly 56% today, leaving the modern market more heavily weighted toward the highest-quality tier of high yield. For some investors, the higher quality skew of high yield and the greater presence of BB-rated bonds have helped broaden the appeal of the asset class over the last decade.
Leveraged loans followed a different path. Corporate lending historically sat within the banking system, with banks originating loans and retaining the exposure themselves. Over time, the syndicated loan market developed, allowing banks to arrange financing and distribute loans to a broader base of investors. Institutional demand grew alongside it, with collateralized loan obligations becoming an important source of demand for leveraged loans. Secondary trading expanded, pricing and data have become more observable and dedicated managers and benchmarks emerged. Today, the Bloomberg US Leveraged Loan Index represents nearly $1.4 trillion across more than 1,200 loans (Source: Bloomberg. Index market value as of October 28, 2026).
The development of the leveraged loan market also expanded the types of exposure available within institutional credit. Unlike traditional corporate bonds, leveraged loans are typically floating-rate and senior secured, giving investors exposure to a different part of the capital structure along with less sensitivity to interest rates. As the leveraged loan market has become more institutionalized, investors have greater access to floating-rate credit as a complement or diversifier to traditional fixed-rate bond exposure.
Other developments broadened the fixed income market in a different way. Treasury Inflation-Protected Securities, first issued by the US Treasury in 1997, created a dedicated market for government debt whose principal adjusts with inflation. Over time, TIPS developed into an established segment of the Treasury market across multiple maturities, giving investors direct exposure to real interest rates and inflation protection alongside traditional nominal Treasuries. Where high yield and leveraged loans expanded the range of borrowers and credit available to institutional investors, TIPS expanded the types of exposures available within the existing government bond market. The Bloomberg US Treasury Inflation-Linked Bond Index stands at $1.4 trillion today, up from $360 billion in 2006, Bloomberg data shows (Index market value as of October 28, 2026).

High yield, leveraged loans and TIPS illustrate different ways in which the fixed income opportunity set has expanded. Other markets have added further dimensions. Investment-grade floating rate securities provide high-quality credit exposure with coupons that reset alongside short-term rates, offering investors another source of floating-rate exposure beyond leveraged loans. Securitized markets have also expanded the range of exposures available to investors, extending across residential and commercial mortgages, auto loans, credit card receivables and other underlying assets.
What does a broader fixed income market mean for investors?
As the fixed income market has broadened, traditional core sectors have been joined by newer institutional credit markets. The Bloomberg US Total Fixed Income Market Index brings these different parts of the market together within a single benchmark. As of October 28, 2026, the index represents $39.9 trillion across more than 23,000 securities, including US Treasuries, investment–grade and high yield credit, USD emerging market debt, mortgage-backed and other securitized debt, leveraged loans and TIPS.
The breadth of the index extends beyond the number of sectors represented. It brings together fixed and floating–rate debt, borrowers across the credit spectrum and securities backed by different forms of collateral. The Bloomberg US Total Fixed Income Market Index brings this breadth into a single benchmark designed to reflect today’s fixed income market.
- BlackRock has launched the iShares Total USD Fixed Income Market ETF, tracking the Bloomberg US Total Fixed Income Market Index (I40263), under the ticker BTOT.