Bloomberg Professional Services
This article was written by Jigna Gibb, Head of Commodities and Digital Assets Indices at Bloomberg.
Trend investing is one of the most established ways of capturing absolute returns across all asset classes. Commodity Trading Advisors – CTAs – are a popular way to access multi-asset momentum investment, although they originate from trading systematic strategies on commodity futures. The conventional window for many momentum signals has been 12 months less 1 month; measuring long-term moves over the past year while eliminating short-term noise. But why stick with the standard? In this article, we explore trends in commodities sectors and introduce the concept of “Rainbow Trend”.
Performance, stability and reliability assessment
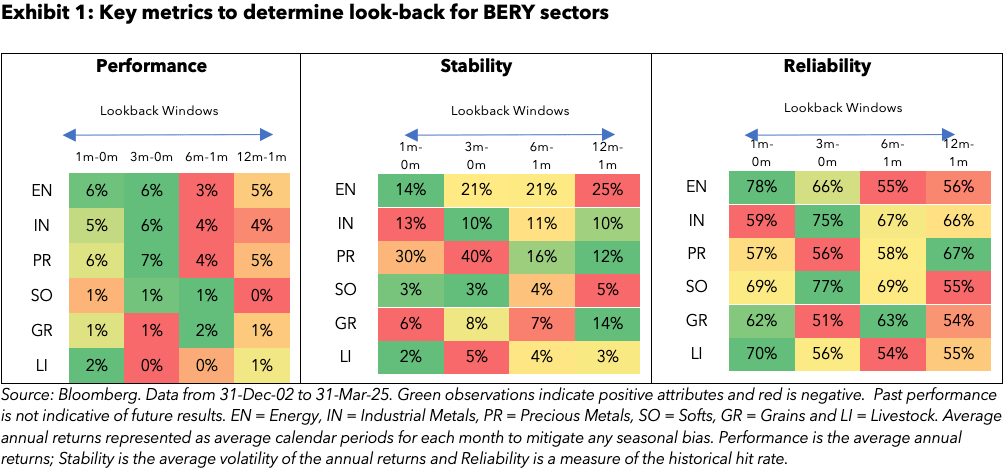
Too often signal-based strategies are designed with single parameter optimization, in our assessment we identify four key metrics to determine the appropriate lookback window for signal generation per sector. These metrics are historical performance, the stability of annual returns, how reliable returns have been for each window and fundamental rationale. The results of the first three metrics are shown in the heatmaps of Exhibit 1.

From the heatmaps above, we have each row representing a commodity sector and the four different lookback windows across the columns. For Energy and Livestock sectors, the 1m-0m windows are favourable across performance, stability and reliability metrics. All the metrics for Industrial Metals select 3m-0m window. While the Precious Metals favour 12m-1m historically for stability and reliability, performance has been slightly better for the shorter windows. For the Softs and Grains, 6m-1m is chosen over 3m-1m based on their seasonal nature. For the agricultural sectors, we anchor signal performance at the start of January and June to avoid crossing seasons.
No rainbow without rain – fundamentals matter
We introduce Rainbow Trend showing that different assets have different half-life cycles as represented by the coloured arcs of the rainbow. Each of the commodity sectors exhibits different patterns based on fundamentals. Precious metals are connected to the macro cycle, grains and softs are seasonal in nature, industrial metals are linked to the economic cycle and growth expectations, whereas energy and livestock are often driven by their own idiosyncrasies. Therefore, in Rainbow Trend, we consider using different lookback windows for each sector based on fundamentals and multiple metrics, rather than sticking with the standard signal of 12m-1m window for all.

Building BERY rainbow trend
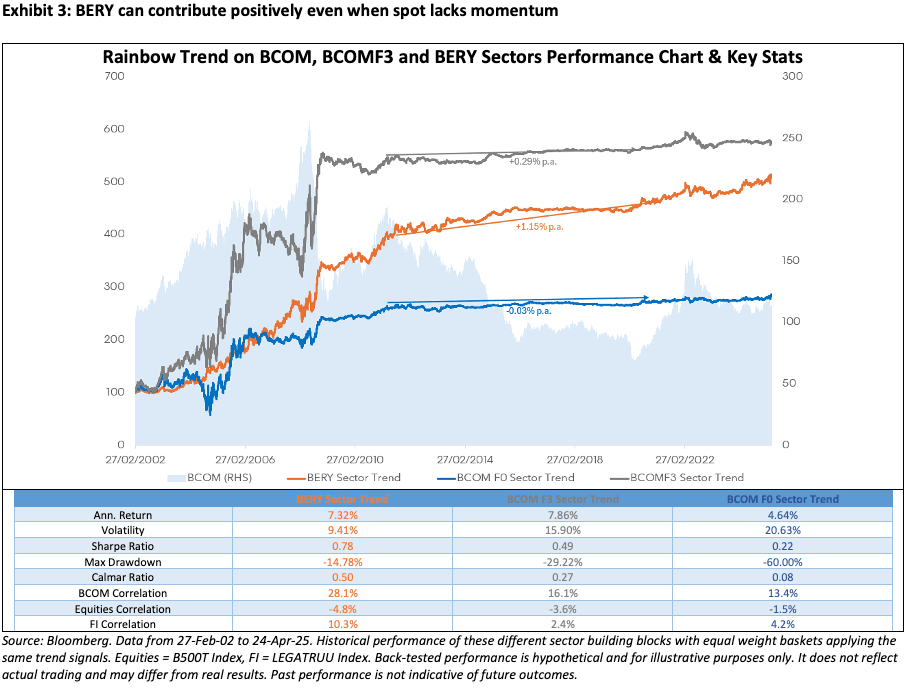
Bloomberg offers commodity sector indices across BCOM F0, BCOM F3 and BERY. In Exhibit 3, we tested each of these in the Rainbow Trend model with monthly rebalancing. The advantage of BERY is that it offers trending characteristics from both spot moves, and from its curve and carry returns. During periods of muted price momentum, the BERY version could harvest positive returns: in 2011-2020 period commodities lack a clear directional trend, but the BERY version still contributed +1.15% p.a. Even though we use BERY in this article, the same principles of Rainbow Trend can apply on BCOM F0 and BCOM F3 sectors.

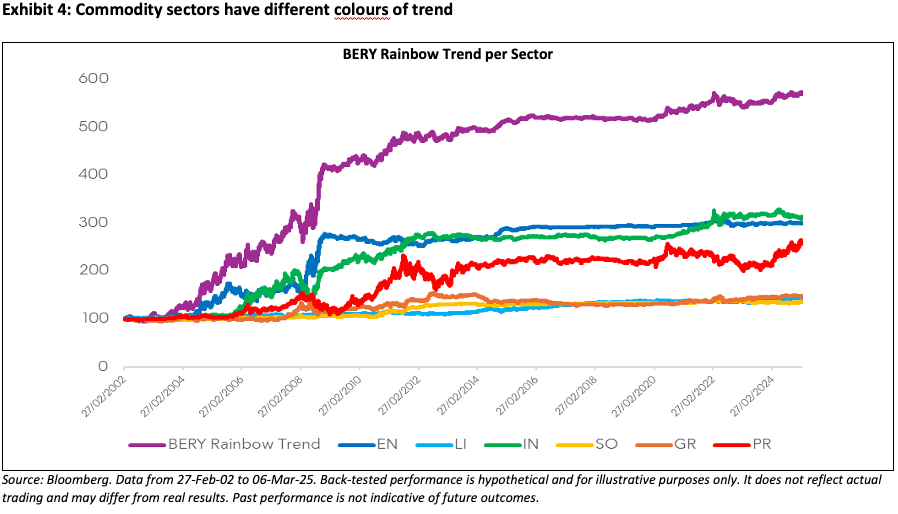
Interestingly, certain commodity sectors are “more trendy” than others which is seen in Exhibit 4. Higher momentum assets such as energy, industrial and precious metals tend to show stronger propensity to trend versus the agriculture and livestock sectors. The BERY commodity sectors are part of the BERY index family and the BERY index is a broad-based long commodity index. In the BERY Rainbow Trend strategy below, we apply the annual BERY target weights to long and short weights. When the BERY Rainbow Trend is combined as an overlay to BERY, we create a strategy that harvests trend, curve and carry premia in commodities.

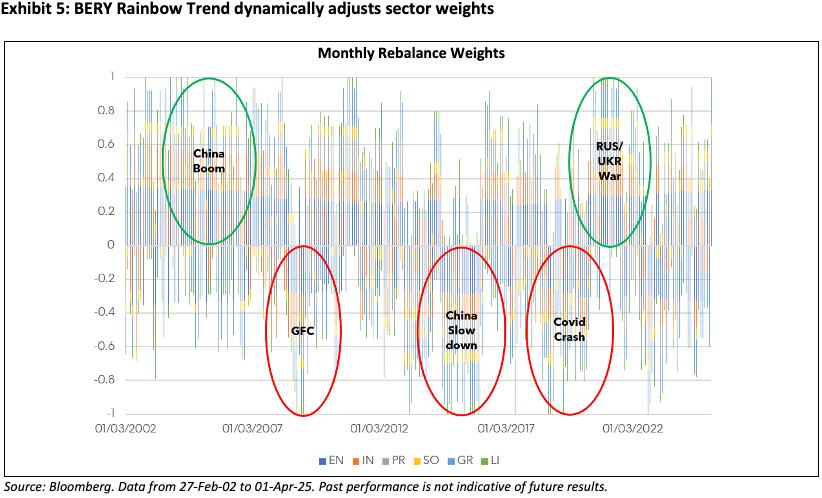
BERY Rainbow Trend strategy dynamically adjusts its positions monthly, as highlighted in Exhibit 5, the strategy positions +100% during periods such as China-led demand boom of the late 2000s and Russia / Ukraine war and shifts position to -100% during correction episodes of Global Financial Crisis, China’s economic slowdown and Covid Crash. Post Trump Tariffs, the BERY Rainbow Trend strategy has positioned +100% in April 2025 to fully participate in recent market bounce. The average historical position was +10% and the average annual turnover was around 60% showing some stability in the signals.

Trend is your friend, until the ends when it bends into a rainbow
BERY Rainbow Trend can be used alongside long-only BERY investment or used stand alone as long-short to seek positive returns regardless of market direction. When successful, these trend strategies ride up the upward trajectory whilst pivoting positions in a timely manner without encompassing excessive turnover or transaction costs.
The BERY Rainbow Trend strategy can act as a diversifier or defensive overlay in multi-asset portfolios. In the Rainbow Trend model, we examine multiple lookback windows and use a metric-based assessment based on fundamentals, performance, stability and reliability to determine the prime lookback window or combinations for each sector. Overall, the BERY Rainbow Trend strategy has long-term correlations that are neutral against Equities and Fixed Income at -4.5% and 6.9% respectively and slightly positively correlated with long commodities at +25%. More widely, the Rainbow Trend model can be expanded for trend strategies in a cross-asset universe.
When market performances are grey, BERY Rainbow Trend brings colour!
The data and other information included in this publication is for illustrative purposes only, available “as is”, non-binding and constitutes the provision of factual information, rather than financial product advice. BLOOMBERG and BLOOMBERG INDICES (the “Indices”) are trademarks or service marks of Bloomberg Finance L.P. (“BFLP”). BFLP and its affiliates, including BISL, the administrator of the Indices, or their licensors own all proprietary rights in the Indices. Bloomberg L.P. (“BLP”) or one of its subsidiaries provides BFLP, BISL and its subsidiaries with global marketing and operational support and service. Certain features, functions, products and services are available only to sophisticated investors and only where permitted. Bloomberg (as defined below) does not approve or endorse these materials or guarantee the accuracy or completeness of any information herein, nor does Bloomberg make any warranty, express or implied, as to the results to be obtained therefrom, and, to the maximum extent allowed by law, Bloomberg shall not have any liability or responsibility for injury or damages arising in connection therewith. Nothing in the Services or Indices shall constitute or be construed as an offering of financial instruments by Bloomberg, or as investment advice or investment recommendations (i.e., recommendations as to whether or not to “buy”, “sell”, “hold”, or to enter or not to enter into any other transaction involving any specific interest or interests) by Bloomberg. Information available via the Index should not be considered as information sufficient upon which to base an investment decision. All information provided by the Index or in this publication is impersonal and not tailored to the needs of any person, entity or group of persons. Absence of any trademark or service mark from this list does not waive Bloomberg’s intellectual property rights in that name, mark or logo. For the purposes of this publication, Bloomberg includes BLP, BFLP, BISL and/or their affiliates.
BISL is registered in England and Wales under registered number 08934023 and has its registered office at 3 Queen Victoria Street, London, England, EC4N 4TQ. BISL is authorised and regulated by the Financial Conduct Authority as a benchmark administrator.
© 2025 Bloomberg. All rights reserved.