Bloomberg Professional Services
This article was written by Amine Khanjar, Quantitative Researcher at Bloomberg.
Throughout their history, the flagship Bloomberg Fixed Income indices have sold securities as soon as their maturity date was less than one year. These ultra short duration debt instruments have minimal interest-rate sensitivity and are typically an attractive option for conservative investors who want to have quick access to their money. Returns for these bonds have historically been higher than money market accounts but lower than conventional short-term bonds in a ‘typical’ upwards sloping yield curve environment.
More recently, amid aggressive central banks’ tightening in 2022 and 2023 and persistent global yield curve inversions over the past two years, investors have increasingly turned to ultra short-term securities because of their recent relative outperformance and current attractive risk return profile. As a result, Bloomberg launched two new families of indices covering the Hold-To-Maturity indices and 0-1 Year Maturity indices.
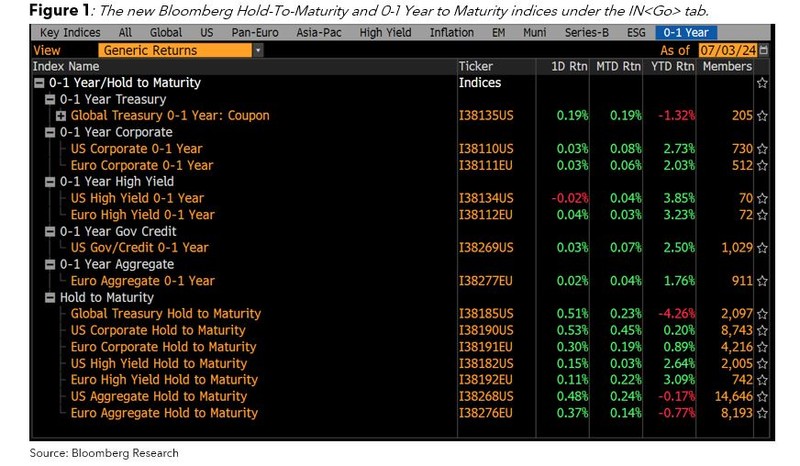
The Hold-To-Maturity indices
The new Hold-To-Maturity (HTM) indices have the same security entry and exits rules as the corresponding flagship index except for the 1Y to maturity eligibility rule. While the flagship Fixed Income indices sell securities as soon as their maturity date is within one year, the HTM indices keep these bonds until they mature. This, therefore, reduces their overall duration as well as their turnover/transaction costs drag. Historically, the 1Y maturity threshold has been, on average, the reason about 2/3 of the securities leave a flagship index on a given month.
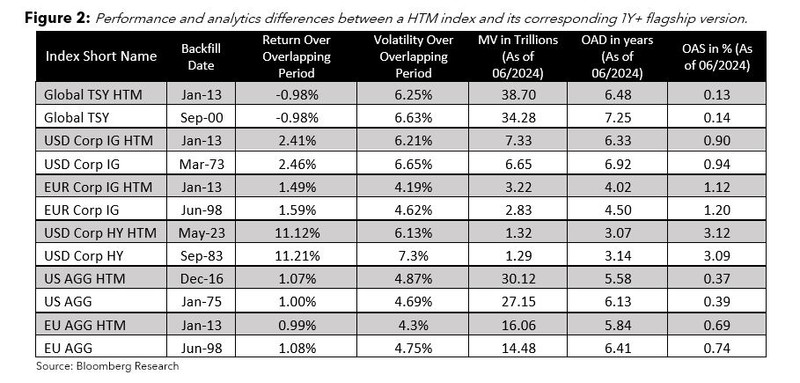
Figure 2 showcases the differences in market value, spread, duration and performance between the new Hold-To-Maturity indices and their corresponding flagship index over the period the two times series are available.
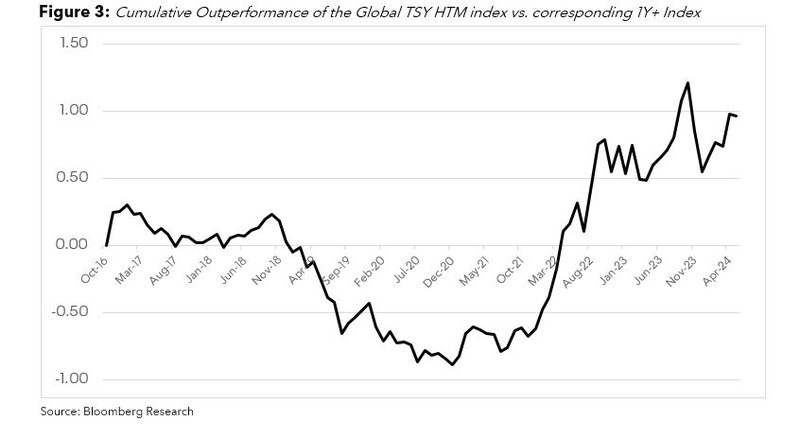
The HTM version of the Global Treasuries index (unhedged) added 13% market value (or around 4 trillion dollars) as of June 28th, 2024, when compared with the flagship Global Treasuries index. Its duration is 9 months shorter leading to a 6% lower annual volatility over the last 12Y. The aggregate returns of the two indices are similar since 2013 (at -1%) with a period of underperformance earlier on in the sample followed by outperformance since late 2021. The rapid central banks tightening in response to rising global inflation has led most of the developed market yield curves to invert. The hold to maturity version of the index outperformed by around 2% over that period as Figure 3 shows.
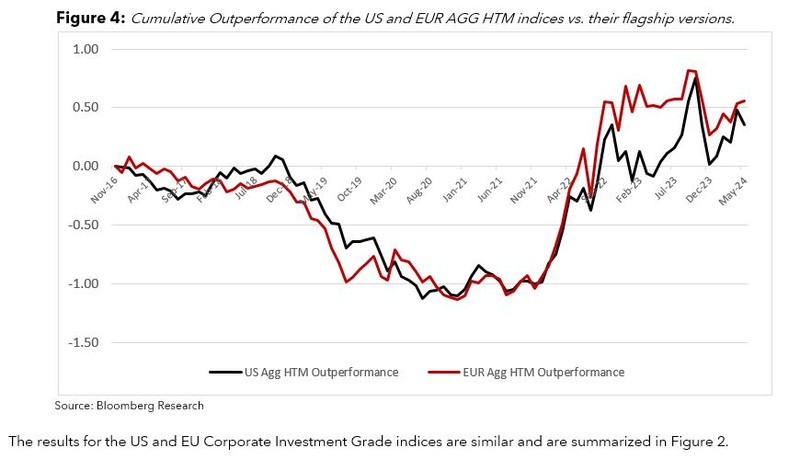
The HTM versions of the US and EUR Aggregate added 11% market value as of June 28th, 2024, when compared with their corresponding flagship indices. Their respective durations were both 6 months shorter.
Similarly, their aggregate returns over the full sample period are comparable to the corresponding 1Y+ years to maturity versions over the full 2016-2024 sample period with an outperformance of 1.4% and 1.5% for the US Agg and EUR Agg HTM indices respectively since 2022.
The 0-1 Year to Maturity indices
The new 0-1 Year to maturity indices are comprised of securities which exited from flagship indices because they no longer satisfy the 1Y+ to maturity eligibility rule. This new family of indices rebalances monthly and holds securities until they mature. At any point in time, a given 0-1Y index’s membership can be defined as the difference between the list of securities in the Hold-To-Maturity Index and its corresponding 1Y+ flagship version.
Ultra-short duration bonds offer a compelling mix of safety, liquidity, and returns, making them a valuable component of a well-rounded investment portfolio. While they are not without risks, their minimal interest rate sensitivity and very short duration make them an attractive option for investors looking to preserve capital and manage short-term financial needs.
Figure 5 illustrates the market value, analytics, and performance of the members of the newly launched family of 0-1 year to maturity indices.

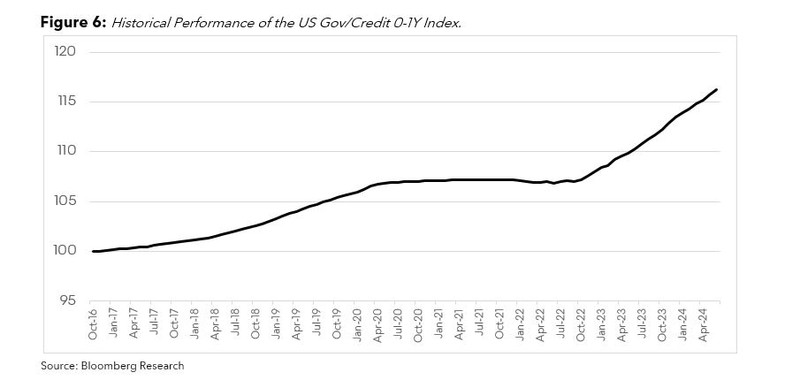
The US Gov/Credit 0-1Y current market value stands at around 3 trillion US dollars. It is comprised of 78% ultra-short duration treasury and government related bonds and 22% Investment Grade corporate bonds. It has averaged a 2% annual return since late 2016 with 56bps annual volatility. It has averaged a duration of around 6 months.
Figure 6 shows, as expected, that the return of the index is closely tied to the prevailing short-term borrowing rate set by the central bank. The index had moderate returns over the 2016-2019 period when the FED rate was at around 2%, was flat from 2020 to early 2022 when the rate was set to 0 in response to the COVID pandemic. Most recently, the index averaged around 4.3% return as the Federal Reserve aggressively tightened its monetary policy.
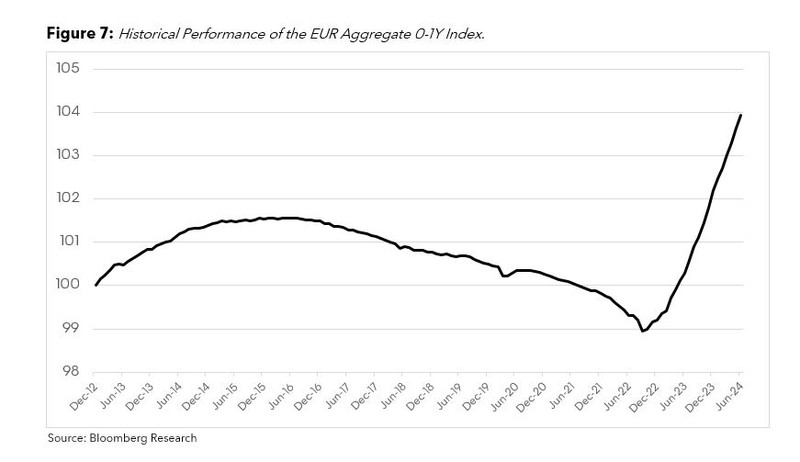
The EUR Aggregate 0-1Y index, on the other hand, has a market value of 1.6 trillion Euros as of June 28th, 2024. It is comprised of 66% ultra-short duration treasury and government related bonds and 33% Investment Grade EUR corporate bonds. It has averaged a 33bps annual return since late 2013 with 46bps annual volatility.
Figure 7 shows an akin performance pattern for the EUR Aggregate 0-1Y Index. The Index had a negative return over the 2017-2022 period when the short-term borrowing rate in Europe was negative. Most recently, the index averaged around 2.4% return over the last two years as the European central bank similarly tightened its monetary policy.
