Bloomberg Professional Services
This article was written by Mike Pruzinsky and Sean Murphy, Equity Index Product Managers at Bloomberg Index Services (BISL).
As the first half of 2025 draws to a close, global markets have navigated a complex landscape marked by shifting macroeconomic trends, geopolitical uncertainties, and evolving investor sentiment. While returns broadly have been positive, the road traveled has been full of surprises and volatility.
PRODUCT MENTIONS
US equity indices
US equities, as measured by the Bloomberg US Large Cap Index (B500), posted a return of 6.5% for the first half of the year. This result is impressive when considering where the index was just a few short weeks ago. In early April, equity markets sold off rapidly after the announcement of planned tariffs to be imposed on imports to the United States. The Bloomberg 500 hit its lows for the year a few days later, tallying at one point a -15% year-to-date return. Since the lows reached on April 8th, however, the index has rebounded sharply, rallying over 25% off the lows. Investors have pointed to several reasons for this rally, including trade progress, strong earnings, AI, and others.
Despite strong returns for US large cap companies, concerns still linger that the world’s largest economy may be heading for a slowdown. Small cap stocks tend to be more sensitive to economic concerns. As such, the Bloomberg US 2000 Index (B2000) posted a -3.0% return for the first half of the year. Many such companies are more reliant on the debt market, and as interest rates have risen this year, their costs are also expected to rise.
Sector and style indices
Though tech (B500TE) was the largest contributor to US returns through June, the communications sector (B500C) is this year’s best performer so far, totaling 13% through the first six months. Names like Meta (+25%) and Netflix (+50%) have been the primary contributors to the sector’s hot start to 2025. Of the 11 BICS sectors, only Health Care (B500H) and Consumer Discretionary (B500CD) are in negative territory.
Based on the sector observations just mentioned, it should come as no surprise that Growth indices have outpaced their Value equivalents thus far across the cap spectrum. This fact may be hard to believe for some, as the Bloomberg 1000 Value index had a 10% lead on its Growth counterpart at the time of the April lows, when investors sought the relative safety of lower-risk sectors like consumer staples and utilities. That lead proved short lived, as market participants became more optimistic about trade and earnings, with the Bloomberg 1000 Growth Index eking out a return of 6.3% vs 5.9% for its value counterpart.
International equity indices
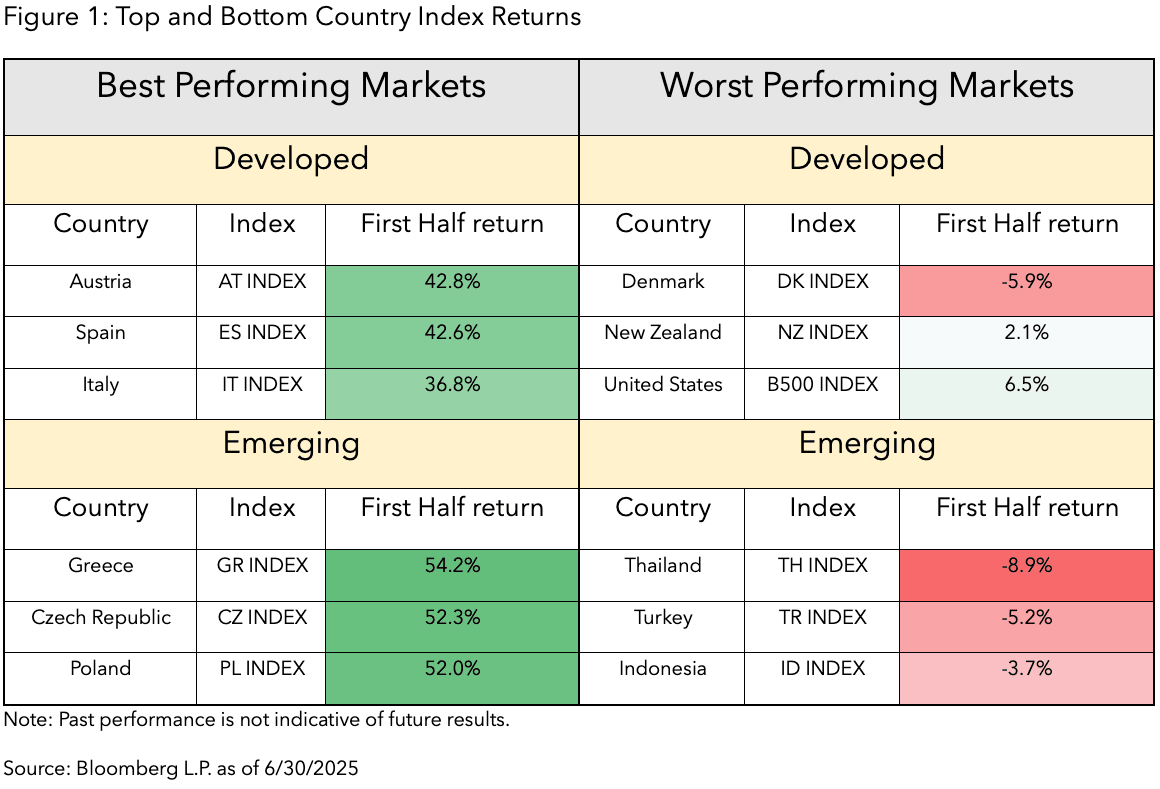
Outside of the United States, equity returns have outpaced US markets meaningfully, especially in USD terms. The Developed Markets ex- US Index (DMEU) is up nearly 20% thus far in 2025. In looking closely at these returns, however, nearly half is attributable to dollar weakness, as the Bloomberg Dollar Spot Index (BBDXY Index), which tracks the performance of the dollar verse 10 leading global currencies, is down 9%. Emerging Market equities (EM Index) have also performed well despite the negative trade headlines, outpacing US equites with a 13.4% first half return. Even China (CN Index) has rebounded off the trade-headline lows to return 12.6% thus far.
Thematics
One common thread among the best and worst performing thematic indices is their current relevance in the political or geopolitical arena. Defense oriented indices have done particularly well this year, especially those with specific regional exposure. The Bloomberg Europe Defense Select Index (BSHIELD), for example, closed out the first half of the year up 77% as Europe aims to not just increase defense spending but also increase in-continent defense reliance in light of the war in Ukraine and historical reliance on the US.
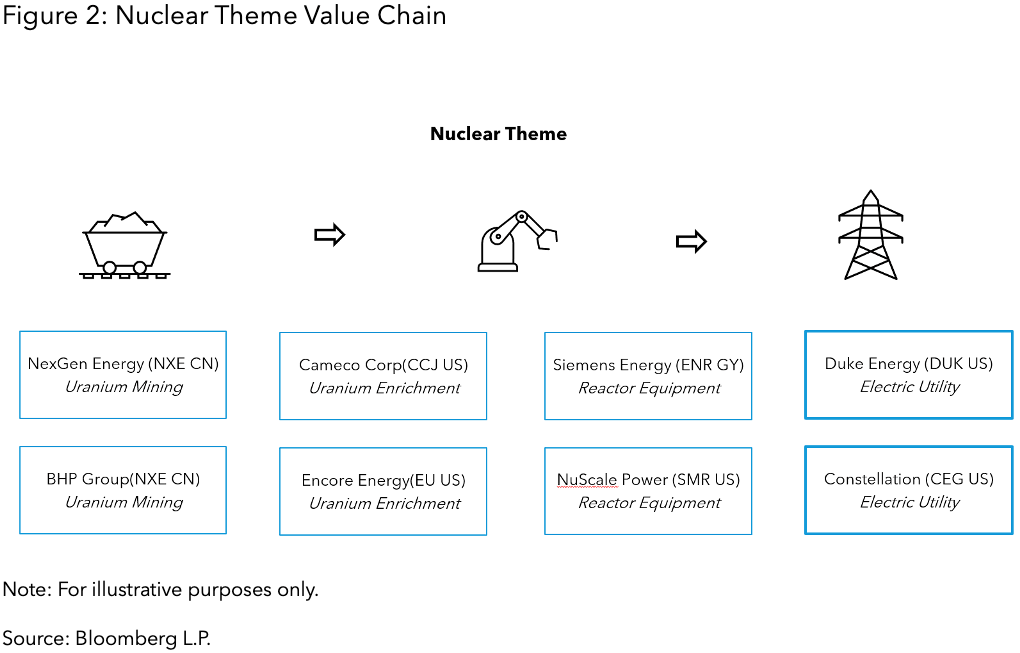
Nuclear energy, long shunned by governments the world over, has found a renewed interest as a possible solution for the energy demands of artificial intelligence. Here in the US, reforms have been discussed and implemented to expedite nuclear energy development. Even some European nations are considering reversing nuclear phase-out policies. While names that operate nuclear plants have rallied, so too have other elements of the value chain, such as uranium miners and refiners. The Bloomberg Nuclear Aggregate Index (BNUAP), which seeks to capture those companies exposed to the theme across the value chain, closed out the first half with a 27% return.
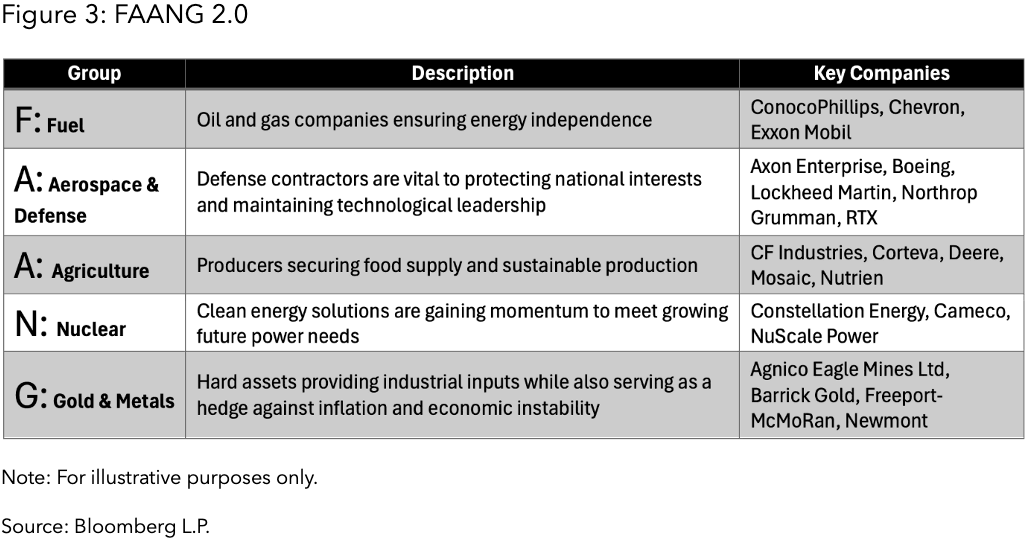
Geopolitical tensions are rising, supply chains are being reimagined, and the need for resource security is taking center stage. The Bloomberg FAANG 2.0 Select Index (BFAANGST) is a strategically constructed benchmark that captures the essential pillars of modern society: Fuel (F), Aerospace & Defense (A), Agriculture (A), Nuclear (N), and Gold & other Base and Precious Metals (G). Although past performance is not indicative of future results, that index has also outperformed the global equities (WORLD), tallying a 24.8% return year-to-date.
Enhanced factors
With market volatility, many equity investors have sought ways to de-risk their portfolios. While some have headed for the sidelines, others have instead maintained their equity allocation while employing more defensive positioning. ETF strategies that target low–volatility, quality, and dividend stocks have been gathering assets this year. Nonetheless, many such strategies have struggled this year. Rather than targeting these factors individually, indices that tilt to multiple factors have provided different outcomes in 2025.
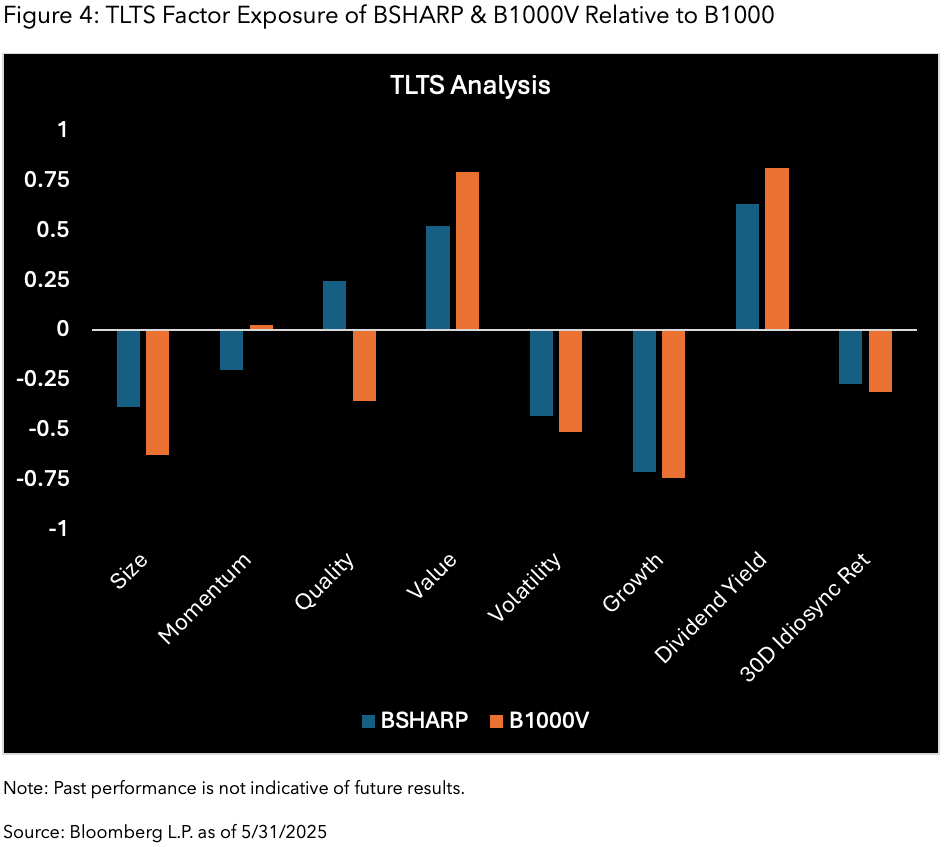
The Bloomberg Shareholder Yield Index (BSHARP) examines the total return of capital, which includes dividends paid, net buybacks, as well as debt repayment. Using the TLTS function on the Terminal highlights exposure to quality and lower volatility companies relative to the market cap weighted Bloomberg 1000 Index. The Bloomberg Shareholder Yield Index returned 7.8% through the first half of the year, outpacing the Bloomberg 1000 index by 1.61%.
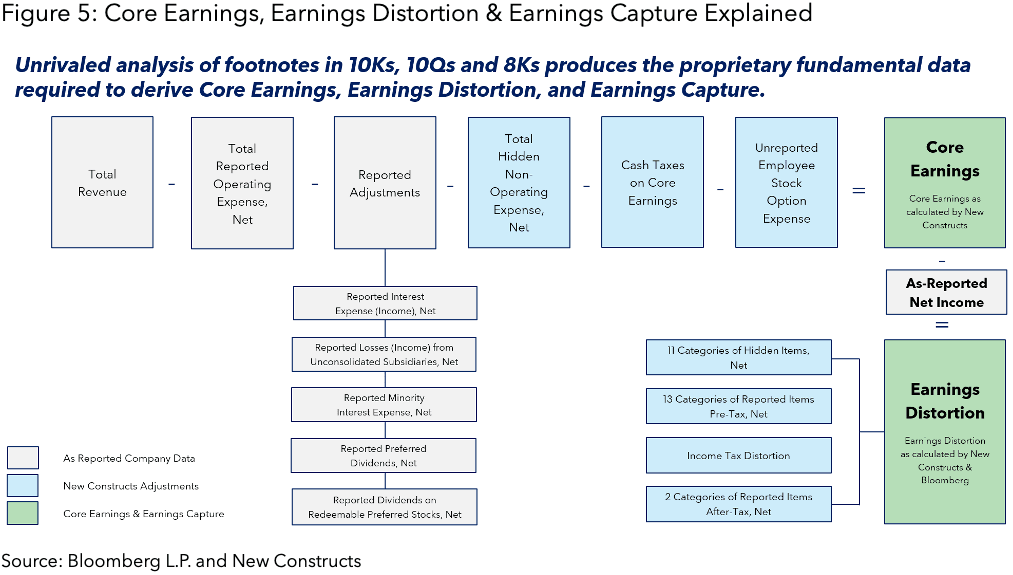
Traditional factor-based indices that rely on metrics like profitability, valuation or cash flow to determine security selection may miss potential winners. The Bloomberg Core Earnings Leaders Index (BCORE Index) (developed in partnership with independent research technology firm New Constructs) leverages a pioneering AI-based parsing process and machine learning technology to target a company’s Core Earnings by going beyond as-reported fundamentals and into the footnotes, which the market may be missing. That index has returned a robust 12.1% through June, outpacing the Bloomberg 1000 by nearly 6%!
Conclusion
The rebound in equity markets, particularly here in the U.S., highlights the resilience of investor sentiment in the face of geopolitical headwinds, inflationary concerns, and evolving government policy. The broader macroeconomic and regulatory environment continues to evolve rapidly, and with central banks, governments, and corporations adjusting strategies accordingly, adaptability remains critical. Bloomberg’s Equity Indices can help investors dissect markets with clarity and granularity, allowing for timely observations that can help plot a course in real-time.
The data and other information included in this publication is for illustrative purposes only, available “as is”, non-binding and constitutes the provision of factual information, rather than financial product advice. BLOOMBERG and BLOOMBERG INDICES (the “Indices”) are trademarks or service marks of Bloomberg Finance L.P. (“BFLP”). BFLP and its affiliates, including BISL, the administrator of the Indices, or their licensors own all proprietary rights in the Indices. Bloomberg L.P. (“BLP”) or one of its subsidiaries provides BFLP, BISL and its subsidiaries with global marketing and operational support and service. Certain features, functions, products and services are available only to sophisticated investors and only where permitted. Bloomberg (as defined below) does not approve or endorse these materials or guarantee the accuracy or completeness of any information herein, nor does Bloomberg make any warranty, express or implied, as to the results to be obtained therefrom, and, to the maximum extent allowed by law, Bloomberg shall not have any liability or responsibility for injury or damages arising in connection therewith. Nothing in the Services or Indices shall constitute or be construed as an offering of financial instruments by Bloomberg, or as investment advice or investment recommendations (i.e., recommendations as to whether or not to “buy”, “sell”, “hold”, or to enter or not to enter into any other transaction involving any specific interest or interests) by Bloomberg. Information available via the Index should not be considered as information sufficient upon which to base an investment decision. All information provided by the Index or in this publication is impersonal and not tailored to the needs of any person, entity or group of persons. Absence of any trademark or service mark from this list does not waive Bloomberg’s intellectual property rights in that name, mark or logo. For the purposes of this publication, Bloomberg includes BLP, BFLP, BISL and/or their affiliates.
BISL is registered in England and Wales under registered number 08934023 and has its registered office at 3 Queen Victoria Street, London, England, EC4N 4TQ. BISL is authorised and regulated by the Financial Conduct Authority as a benchmark administrator.
© 2025 Bloomberg. All rights reserved.
