Bloomberg Intelligence
This article was written by Bloomberg Intelligence Senior ESG Climate Analyst Andrew John Stevenson. It appeared first on the Bloomberg Terminal.
Consumers struggle to weather $1 trillion in disaster costs
US disaster costs have increased to a record of almost $1 trillion on a
rolling 12-month basis due to fires, hurricanes and a spike in insurance premiums, representing more than 3% of GDP and effectively creating a stealth tariff on consumer spending, based on our analysis. Climate costs are diverting around $80 billion a month from other economic activity.
US climate impacts are nearly $1 trillion over 12 months
US climate-related spending linked to disasters, insurance premiums, government grants and power outages generated a record $955 billion in economic costs over the past 12 months. The primary drivers were recovery spending from Hurricanes Helene and Milton and the Los Angeles wildfires, resiliency outlays funded by the Inflation Reduction Act (IRA) and US infrastructure legislation, and an 11% bump in multi-peril insurance premiums to $310 billion in 2024.

Costs rise to 3.3% of GDP, with Carolinas hardest hit
Climate-related costs have risen to a record in dollar terms over the past year, but as a percent of GDP the 3.3% is still slightly less than in 2017 (Hurricanes Harvey, Irma) and 2005 (Hurricane Katrina).

At the state level, North and South Carolina were particularly hard hit by Hurricane Helene, which caused over $78 billion in economic losses, equivalent to around 8-9% in local GDP terms, according to BI’s Climate Damages Tracker.
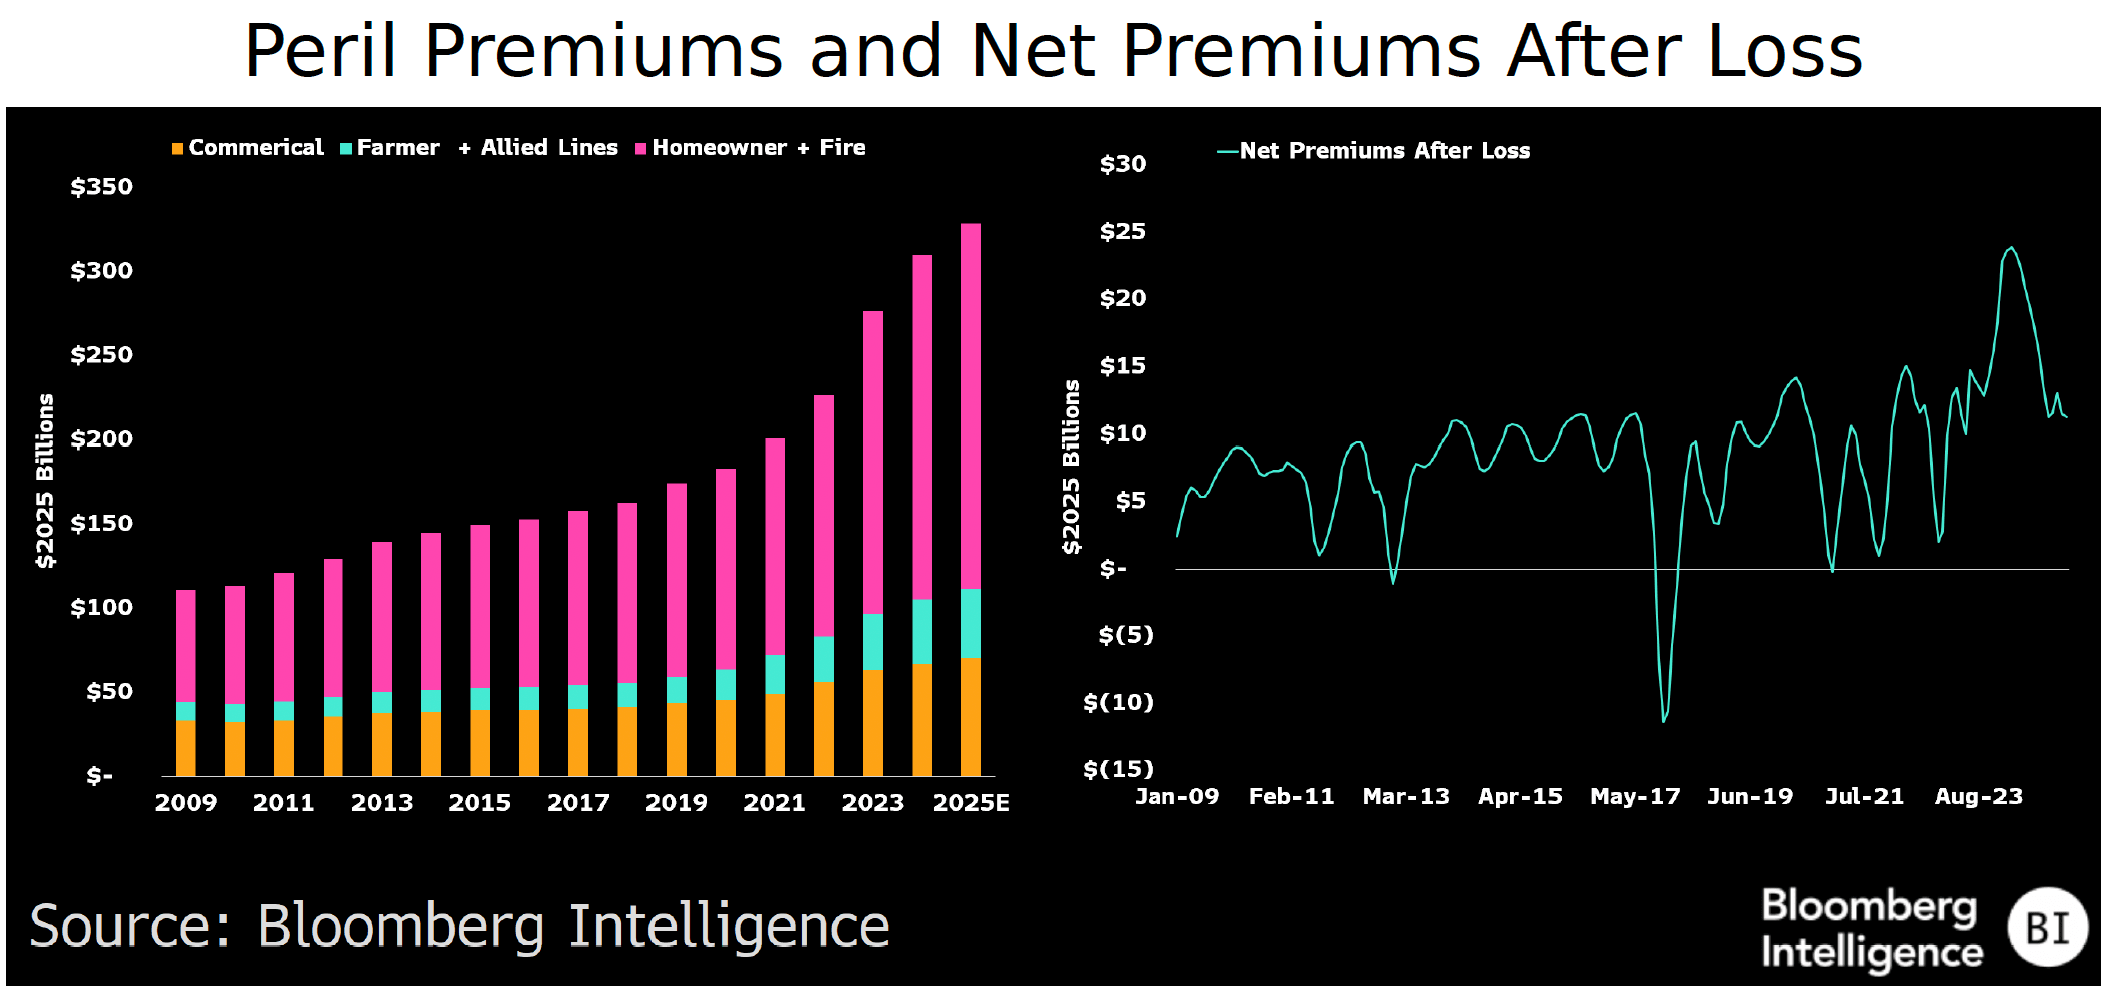
Peril premiums hit $310 billion, but cushion eroding
The rise in fires, floods and storms has forced insurers to reprice risk over the past several years, raising rates by as much as 22% in 2023 and pushing total multi-peril premiums (home, fire, commercial, farmer and allied lines) above $300 billion, according to the National Association of Insurance Commissioners. S&P Global expects premiums to rise 6.2% in 2025. The P&C industry has struggled to price these risks in a way that secures a stable stream of returns. Net premium after loss (total premiums less insured payouts) fell below zero in 2017 and approached zero three times in the past few years.
The big 2023 rate hikes helped create a buffer for Allstate and other P&C insurers, but the cushion has been eroded in recent months by developments including an estimated $40 billion bill for the LA wildfires.

Government spending starting to fade from sight
Federal and state governments have provided nearly $1.3 trillion over the past 20 years to local communities to help them recover sooner from fires, floods and storms. Stimulus measures like the IRA and the infrastructure law have provided the most support ($600 billion), followed by FEMA ($320 billion) and the Department of Housing and Urban Development ($180 billion). States contributed $132 billion, largely in the form of matching funds.

Though these funds have provided a needed lifeline to states, most of the programs are winding down, with President Donald Trump signaling that he wants states to take more responsibility for recovery efforts.
Texas hardest hit by climate followed by California
Total climate-related costs in the US have totaled $10 trillion over the past 20 years, according to the BI Climate Damages Tracker. At the state level, Texas has been hardest hit in dollar terms, with$1.1 trillion in costs, followed by California ($938 billion) and Florida ($763 billion). Though these costs are substantial, the overall size of these states’ economies ($10.4 trillion combined) means the impacts on a GDP basis are generally lower than for lower-GDP states like Louisiana ($425 billion in damages, with a $327 billion GDP in 2024).

How does BI’s damages tracker calculate spending?
In an effort to capture how climate-related costs flow back into the economy, the BI Damages Tracker assigns different spending curves to different types of costs. For example, insured losses, which are generally paid out over one year, with the majority paid in the first six month, are calculated using a 12-month gamma curve, which skews spending toward the first few months following the event.
In this same way, uninsured losses are calculated using a 24-month gamma curve, and government spending is assessed with a 36-month gamma curve, which is based on distributions reviewed in federal spending reports.

The data included in these materials are for illustrative purposes only. The BLOOMBERG TERMINAL service and Bloomberg data products (the “Services”) are owned and distributed by Bloomberg Finance L.P. (“BFLP”) except (i) in Argentina, Australia and certain jurisdictions in the Pacific Islands, Bermuda, China, India, Japan, Korea and New Zealand, where Bloomberg L.P. and its subsidiaries (“BLP”) distribute these products, and (ii) in Singapore and the jurisdictions serviced by Bloomberg’s Singapore office, where a subsidiary of BFLP distributes these products. BLP provides BFLP and its subsidiaries with global marketing and operational support and service. Certain features, functions, products and services are available only to sophisticated investors and only where permitted. BFLP, BLP and their affiliates do not guarantee the accuracy of prices or other information in the Services. Nothing in the Services shall constitute or be construed as an offering of financial instruments by BFLP, BLP or their affiliates, or as investment advice or recommendations by BFLP, BLP or their affiliates of an investment strategy or whether or not to “buy”, “sell” or “hold” an investment. Information available via the Services should not be considered as information sufficient upon which to base an investment decision. The following are trademarks and service marks of BFLP, a Delaware limited partnership, or its subsidiaries: BLOOMBERG, BLOOMBERG ANYWHERE, BLOOMBERG MARKETS, BLOOMBERG NEWS, BLOOMBERG PROFESSIONAL, BLOOMBERG TERMINAL and BLOOMBERG.COM. Absence of any trademark or service mark from this list does not waive Bloomberg’s intellectual property rights in that name, mark or logo. All rights reserved. © 2025 Bloomberg.