Bloomberg Terminal
Charts
Data visualization tools for financial professionals
Uncover powerful insights with dynamic visualization.
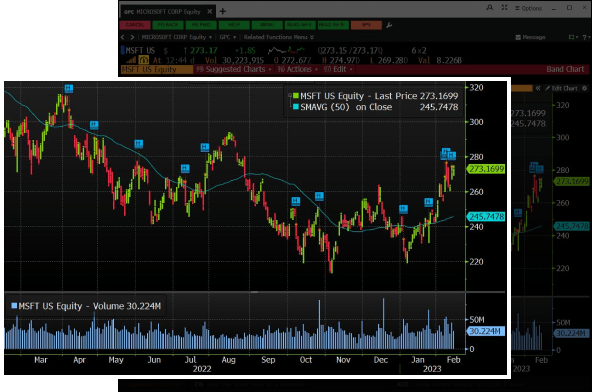
Bloomberg charts provide a smarter, more powerful way to visualize information, support trading strategies, and generate new ideas across every asset class.
Consolidated visual data for faster analysis.
Validate ideas, spot trends and take action when you can plot and compare multiple instruments in a single chart.
Comprehensive market views for global strategies.
Never miss a new market trend, insight or investment opportunity with full-range, visual, market view composites.
Bloomberg Chart Tools
Complete customization
-
Spend more time discovering new opportunities and less time building client presentations.
-
Export professional charts into stakeholder-ready presentations, all annotations included, in just a few clicks.
-
Our pre-packaged chart applications, shortcuts, and templates, allow you to operate with speed and efficiency.


Real-time collaboration
-
Communicate and align on ideas faster with clear and detailed visual charts.
-
Share and co-edit charts with your communities in real time with the support of Bloomberg Launchpad and Instant Bloomberg.
Backtesting and optimization
-
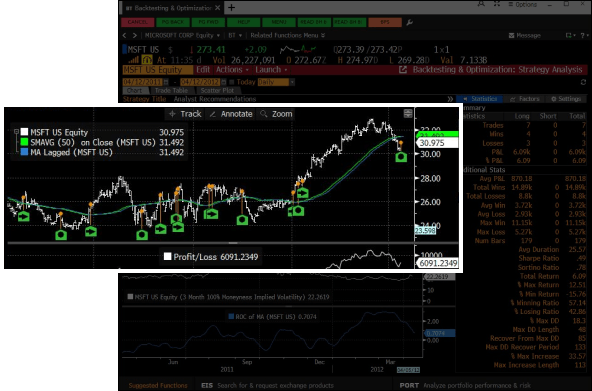
Imitate thousands of scenarios with varied benchmarks to define targeted strategies and techniques for optimal profit over time.
-
Generate powerful trade ideas with clients and colleagues when you design custom, visual studies to support your insights.


Global perspectives
-
Expand your analysis and provide international insights with Bloomberg’s global charting tools.
-
For example, add geographical context and
perspective with our proprietary mapping tool – MAPS <GO>.
-
Visualize multiple data sets on a global scale, from trade flows, to climate risk, manufacturing facilities and more.
Explore Bloomberg products
Bloomberg Professional Services are built on cutting-edge technology with best-in-class data and analytics.


