Solutions / Corporations
Investor Relations
Own your company’s narrative with in-depth market and shareholder insights
As an investor relations professional, you know how to best tell your company story. We give you the tools to do it. As the world’s leading source of financial and market information, Bloomberg empowers IR teams with comprehensive and proprietary data, up-to-the second news, and powerful analytics to help you target investors, navigate shareholder and analyst landscapes, and understand how shifts in global markets will impact your company, your industry and your peers.
Understand investors
Surface insights from in-depth shareholder data & access powerful investor targeting tools.
See what the market sees
Access real-time analyst recommendations, research & estimates, all in one place.
Gather intelligence
Search 200m+ documents on your company, peers, industry & the broader market landscape.
Transform the way you manage IR
Peer Benchmarking
Evaluate competitors to analyze how you rank on key metrics including earnings, fair value estimates and ESG performance. Track and monitor peers by geography, organization, industry or business unit, and compare performance across individual business lines and CSR initiatives to better understand how you measure up.
Investor Targeting
Surface potential investors with unparalleled insight into the buy-side’s biggest players. Uncover the style characteristics that make your company most attractive and utilize comprehensive investor profiles to identify power players in your sector. See who owns your stock and peers, track what they’re trading, and follow corporate activism and proxy votes.
Analyst Insights
Get to know your analysts and their track records with research and earnings estimates that help identify deviations of individual analyst estimates from your company’s guidance, and tools that enable you to compare recommendations side-by-side and refine by price target, time period, total return rankings and more.
Market & Industry Monitoring
See your company and peers the way markets do, using the same news, data and insight investors rely on. Get breaking news alerts, review earnings in real time, monitor social media sentiment, and access proprietary research on 135+ global industries from Bloomberg Intelligence, BloombergNEF and Bloomberg Economics – as well as the analysts who write it.
Communication & Community
The Bloomberg Terminal gives you immediate membership of a global network comprising more than 350,000 influential decision makers across finance, business and government. It also gives you the tools to contact every one of them, including Instant Bloomberg (IB) the leading chat tool used by the global financial community.
Data Visualization
Enrich your industry perspective using interactive charting to visualize key industry data. The Terminal’s powerful, unique features enable you to chart everything from your stock price to capital structure, equity options, fundamentals, short interest, news, corporate actions and competitive performance.
Harness the power of the Terminal
Understand what makes your company unique
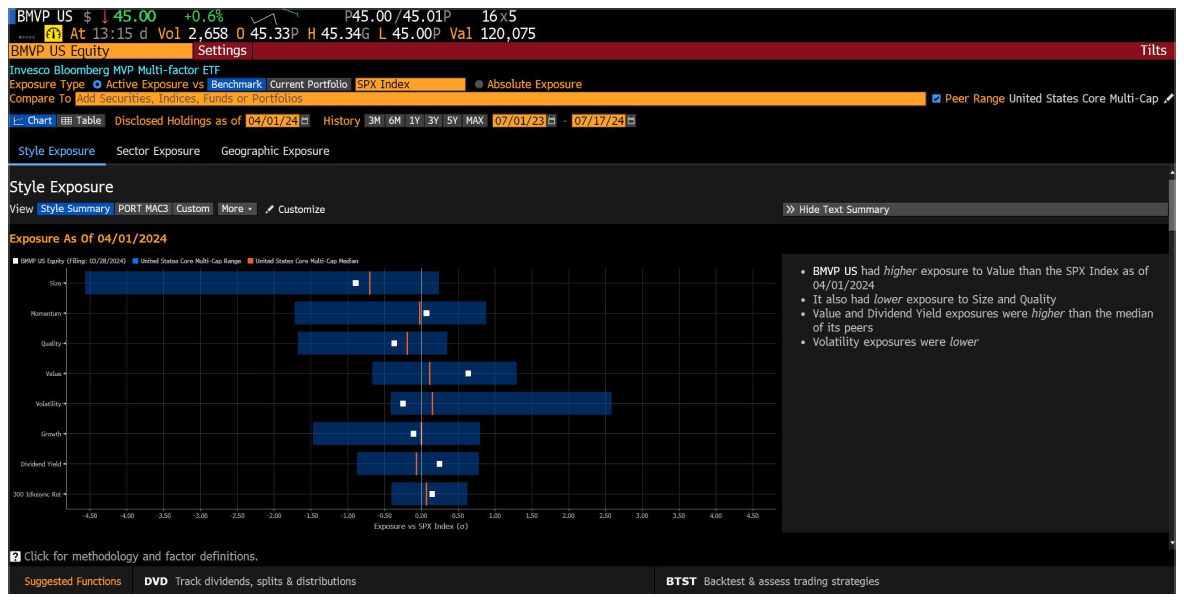
- Profile an index, fund or portfolio’s characteristic exposures – or tilts – and compare them to a peer group or benchmark universe to help you differentiate your company from competing investment options.
- Chart historical changes to see how you or your peer group have moved in and out of a particular benchmark’s style assessment.
Keep tabs on your peers & industry trends
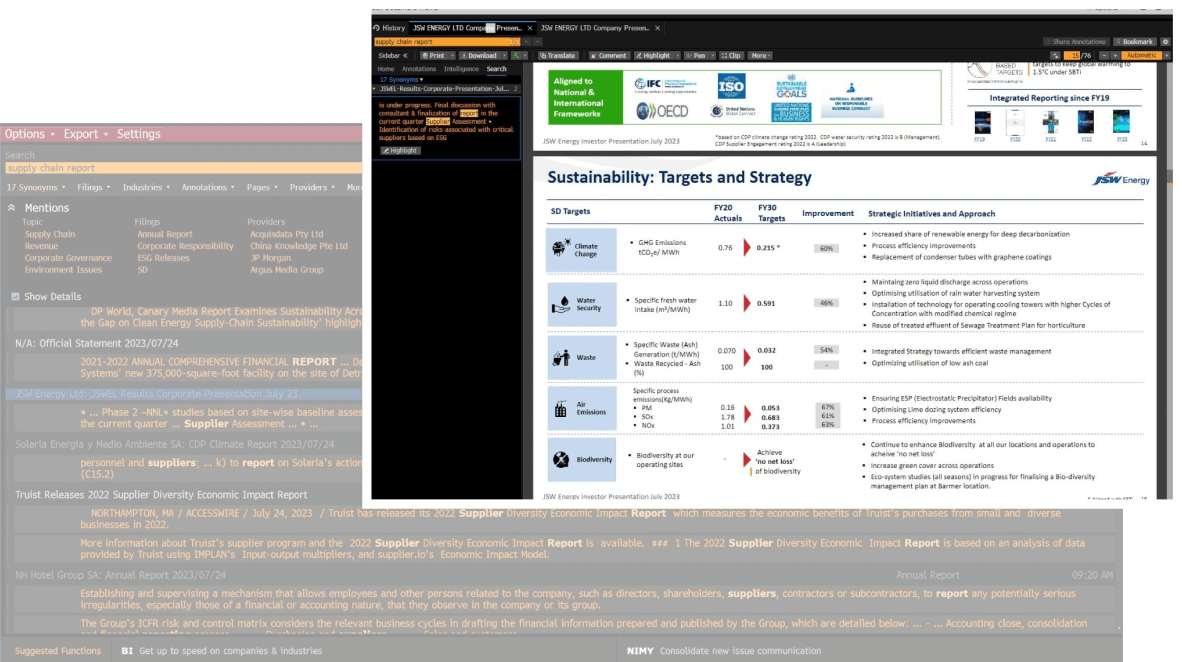
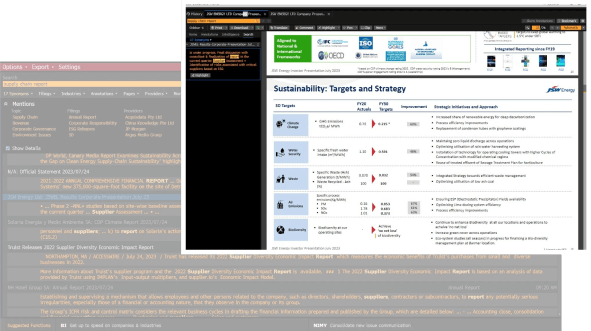
- Search hundreds of thousands of company and industry documents – with AI-assisted precision, Natural Language Processing and summarization – to extract insight on your competitors, industry and the broader market.
- Conduct competitive analysis using Bloomberg’s industry-leading data and analytics, so you can accurately benchmark your company against its peers and make smarter decisions.
Find & compare company financials
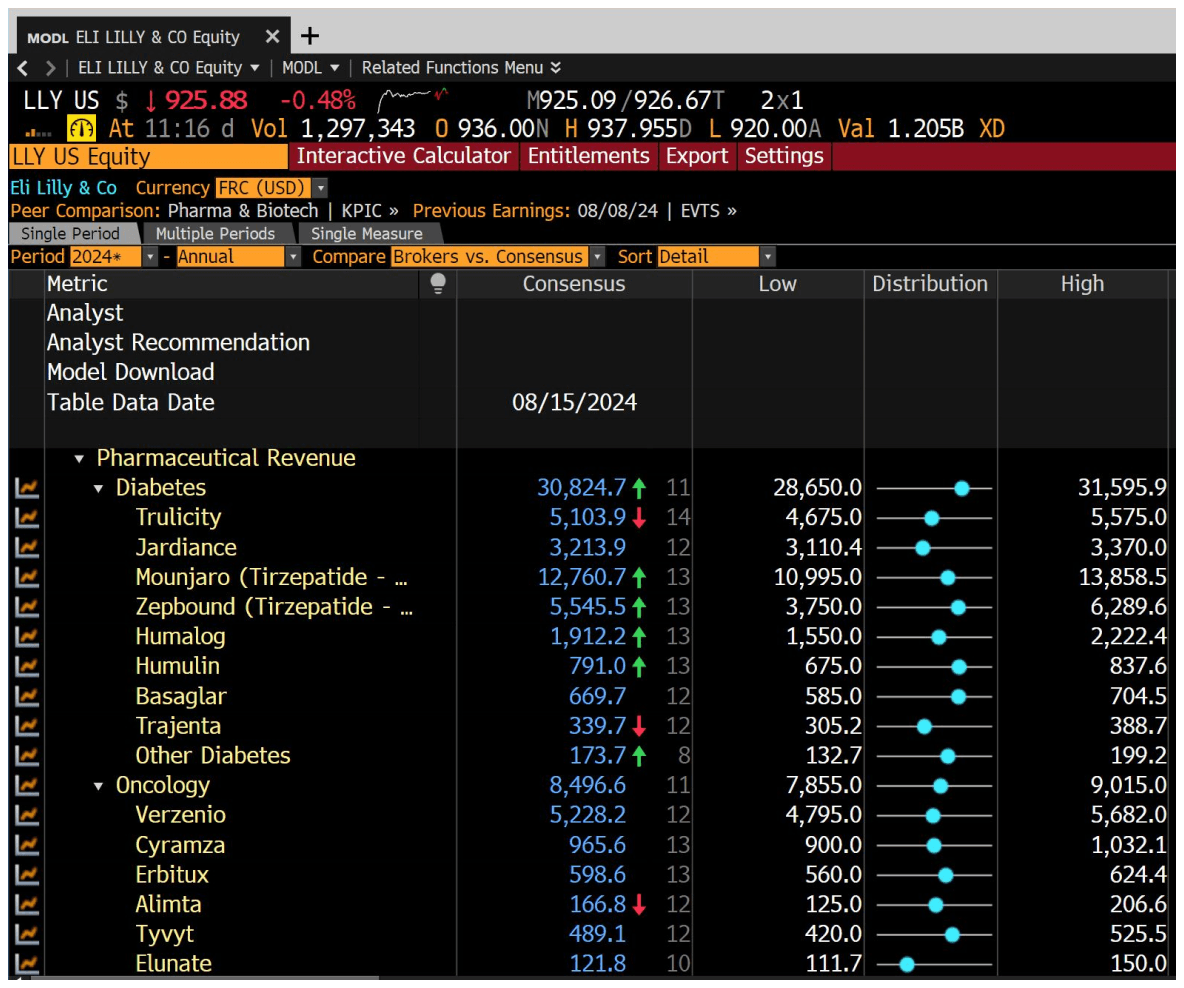
- Monitor earnings, target prices and recommendations by broker or metric to identify trends and gauge market expectations, down to the segment specific estimate.
- Create a customized earnings forecast for a company based on your own assumptions.
